General Tab (ChartLabels)
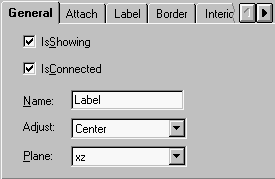
The Name textbox provides a place to modify the name of each label.
Chart2D.ChartLabels.Item(ii).Name
The Offset textbox specifies the distance between the chartlabel and its attachment point.
Chart2D.ChartLabels.Item(ii).Offset
The Anchor dropdown allows you to determine where the chartlabel is positioned, relative to where it is attached.
Chart2D.ChartLabels.Item(ii).Anchor
When selected (checked), the IsShowing checkbox sets the IsShowing property so that the chartlabel is visible.
Chart2D.ChartLabels.Item(ii).IsShowing
The Adjust dropdown allows you to specify how to align multiple lines of text in the selected chartlabel.
Chart2D.ChartLabels.Item(ii).Adjust
When selected (checked), the IsConnected checkbox sets the IsConnected property so there is a line drawn from the chartlabel to its attachment point.
Chart2D.ChartLabels.Item(ii).IsConnected
The Rot’n dropdown allows you to specify the rotation angle of the chartlabel.
Chart2D.ChartLabels.Item(ii).Rotation
The AttachMethod button allows you to modify the how the chartlabel is attached in the Select AttachMethod window. Note, the DataCoord: text, located to the right of the button shows the coordinate location of the chartlabel.
Chart2D.ChartLabels.Item(ii).AttachMethod
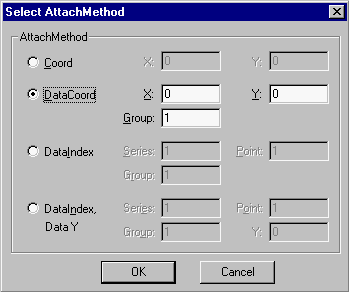
By utilizing the Select AttachMethod window, chartLabels can be attached to screen coordinates, graph coordinates, a series and point in the data, or a Y-value at a series/point.