Creating Stacking Charts
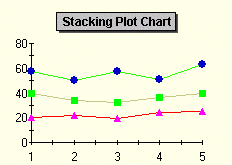
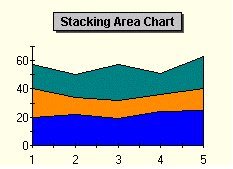
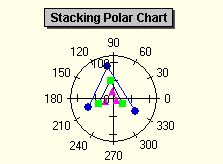
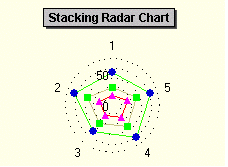
Stacking charts represent the data in a chart in a cumulative fashion by stacking the values for each series on top of the values from the previous series. You can apply stacking using the IsStacked property for Plot, Area, Polar, Radar, and Filled Radar charts.
|
|
|
|
|
|
|
|
|
This property is located on the ChartGroup tab’s General sub tab on the Property Editor.
Note
To remain backwards compatible with previous versions of ComponentOne Chart, StackingBarCharts are implemented as a separate chart type from BarCharts.
 100 Percent Stacking