Bubble Charts
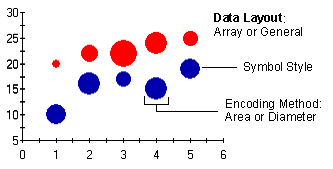
A bubble chart combines 2 series to draw a plot chart with varying point sizes. Bubble charts are used to represent an additional data value at each point by changing its size. The first series determines the Cartesian position (as in a plot chart), and the Y-values from the second series determine the size of the bubble at each point. The size of the points can be encoded according to area or diameter. Using ChartStyles, you can specify the symbol style and color, and whether connecting lines appear.
To Change the Chart Type
Use the ChartType property to set the chart type for one ChartGroup. ChartType is located on the General Tab (ChartGroups) on the Property Pages.
Programming Considerations
The 2 different series used to draw a Bubble chart create a "logical" data set. When programming chart labels, point and set labels and markers, make sure you refer to this logical data set, and not the individual series themselves. For example, if there are 4 series forming 2 different Bubble chart plots, series 0 refers to the first logical data set, and series 1 refers to the second logical data set.