Bar Charts
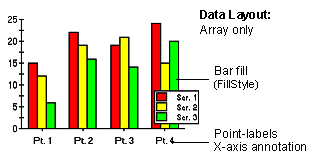
A bar chart draws each series as a bar in a cluster. The number of clusters is the number of points in the data. Each cluster displays the nth data point in each series. Using ChartStyles, you customize the fill properties of each series. You can also customize bar cluster properties and 3D display properties.
To Change the Chart Type
Use the ChartType property to set the chart type for one ChartGroup. ChartType is located on the General Tab (ChartGroups) on the Property Pages. Use the ChartType dropdown to select the appropriate chart.