Attaching the ChartLabel
Chart labels can be attached to a chart in one of four ways:
· to a pixel (x,y) coordinate
· to a data (x,y) coordinate in the chart area
· to a (series, point) in the chart area
· to a (series, point, Y-value) in the chart area
To attach a chart label to a pixel coordinate, set the AttachMethod property to oc2dAttachCoord, and then set the AttachCoord property to the coordinates at which the chart label is to be attached. For example, the following attaches a chart label to the top left corner of the legend:
With Chart2D1.ChartLabels(1)
.AttachMethod = oc2dAttachCoord
.AttachCoord.X = Chart2D1.Legend.Location.Left
.AttachCoord.Y = Chart2D1.Legend.Location.Top
End With
To attach a chart label to a data coordinate on the chart, set the AttachMethod property to oc2dAttachDataCoord, and then set the AttachDataCoord property to the coordinates of the value. For example, the following attaches a chart label to the data coordinate (1.1, 15.8):
With Chart2D1.ChartLabels(1)
.AttachMethod = oc2dAttachDataCoord
.AttachDataCoord.X = 1.1
.AttachDataCoord.Y = 15.8
End With
Chart labels can only be attached to a data coordinate if the chart is an area or plot, and the X-axis is not annotated using point labels. Any part of the chart label that falls outside of the chart area is clipped.
To attach a chart label to a data point, set the AttachMethod property to oc2dAttachDataIndex, and then set the AttachDataIndex property to the series and point values that reference the specified data item. For example, the following attaches a chart label to the second point in the first data series:
With Chart2D1.ChartLabels(1)
.AttachMethod = oc2dAttachDataIndex
.AttachDataIndex.Series = 1
.AttachDataIndex.Point = 2
End With
You can also combine the above two methods, and attach a chart label to a location whose X-coordinate is specified by a data point and whose Y-coordinate is specified by a chart value. To do this, set the AttachMethod property to oc2dAttachDataIndexDataY, as in the following example:
With Chart2D1.ChartLabels(1)
.AttachMethod = oc2dAttachDataIndexDataY
.AttachDataIndex.Series = 1
.AttachDataIndex.Point = 2
.AttachDataCoord.Y = 15.8
End With
In this example, the chart label location is specified as follows:
· The X-coordinate of the second point in the first data series becomes the X-coordinate of the chart label.
· The Y-coordinate specified by the AttachDataCoord property becomes the Y-coordinate of the chart label.
This method is not supported in pie charts.
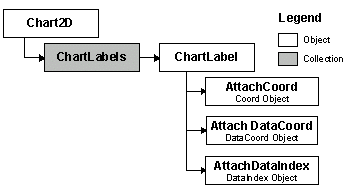
The following is the object hierarchy for the ChartLabels collection and the properties described above: