Annotating with PointLabels
Also, see Axis Annotation Overview.
PointLabels annotation displays the labels you define along the X-axis. This is useful for annotating the X-axis of any chart using Array data layout, including bar, stacking bar, candle, HiLo, HiLoOpenClose, radar, filled radar and pie charts. You can add, remove, and edit PointLabels.
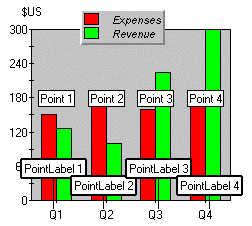
PointLabels are a collection of labels. The first label applies to the first point, the second label applies to the second point, and so on.
Use the PointLabels ChartGroup properties to define and edit PointLabels. These are located on the Labels Tab (ChartGroups) on the Property Pages. Remember to set the X-axis AnnotationMethod to PointLabels.