Adjusting PlotArea Margins
The distance between the edges of the ChartArea and the PlotArea is called a margin. There are separate margins for the top, bottom, left, and right edges. You can allow the chart to automatically control margins, or you can customize them.
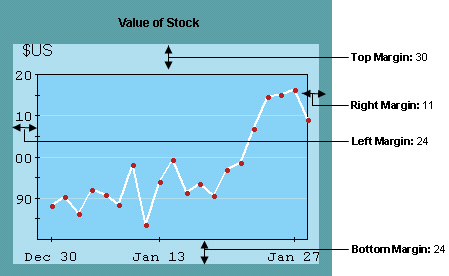
When the chart controls a margin, it sets enough space to display axis annotation and axis title. As axis and data properties change, the chart adjusts the margins as necessary.
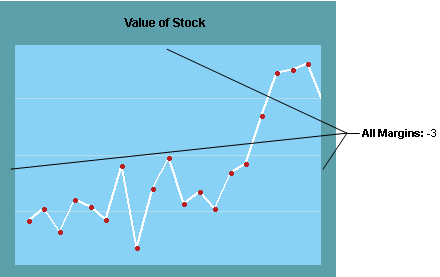
You can fix a margin so that it does not change as axis and data properties change, and to achieve effects such as:
· Scaling or zooming a chart. When margins are all negative, axes and annotations are clipped outside the PlotArea; the chart appears zoomed-in. When margins are all high positive values, there is a lot of space around the PlotArea; the chart appears zoomed-out.
· Moving or translating a chart. For example, when top margin is increased and bottom margin decreased by the same amount, the chart moves down.
It is easier to achieve these effects interactively. See Interacting with the Chart for details.
 Set Margins