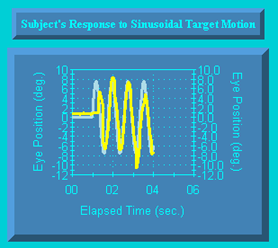
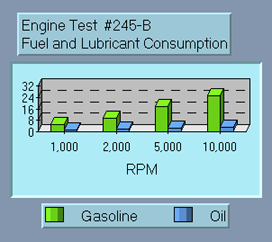
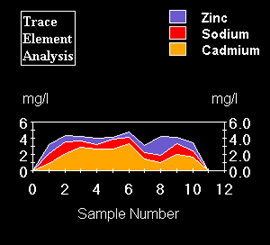
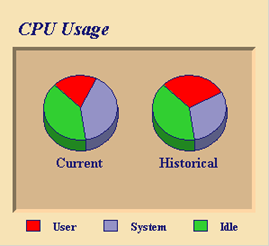
Use the 2D Chart to display data as a bar, X-Y plot, area, stacking bar, pie, radar, filled radar, polar, candle, or combination chart. 2D Chart is optimized for real-time applications displaying rapidly changing data.
|
|
|
|
|
|
| ComponentOne Chart 8.0 > ComponentOne Chart Control Overview > 2D Chart Control |