FlexChart allows you to add secondary axes when you add multiple series to the chart. The scale of a secondary axis represents the values of its associated series. You can even change the ChartType of the associated series to easily identify the values plotted along the secondary axis.
The image below shows how multiple Y axes appear on the FlexChart.
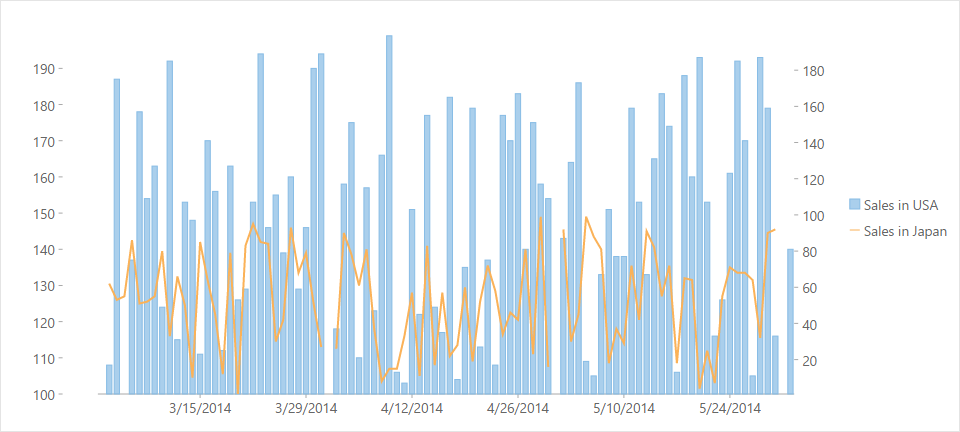
The following code example demonstrates how to add multiple Y axes to the FlexChart. This example uses the sample created in the Mixed Charts section.
| Razor |
Copy Code
|
|---|---|
// Initialize FlexChart @(Html.C1().FlexChart() .Bind("Date", Model) //Add Series to the chart .Series(sers => { //Add the first series sers.Add() .Binding("SalesInUSA") .Name("Sales in USA") .ChartType(C1.Web.Mvc.Chart.ChartType.Column) //Set Y axis position for the first series .AxisY(axis => axis.Position(C1.Web.Mvc.Chart.Position.Left)); //Add the second series sers.Add() .Binding("SalesInJapan") .Name("Sales in Japan") .ChartType(C1.Web.Mvc.Chart.ChartType.Line) //Set Y axis position for the second series .AxisY(axis=>axis.Position(C1.Web.Mvc.Chart.Position.Right)); }) ) |
|