The HitTest() method is used to determine X and Y coordinates, as well as the index of a point on the FlexChart where the mouse hovers.
The following image shows how labels below the chart display the X, Y coordinate values and the index of the hit point on FlexChart.
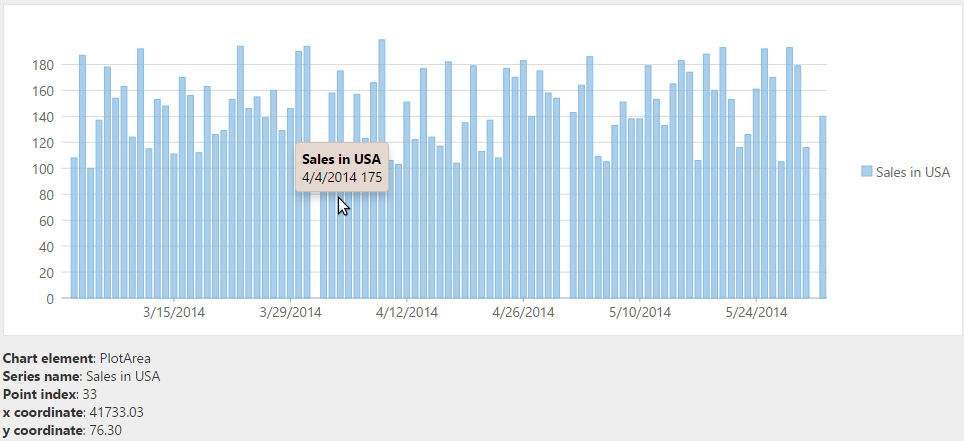
The following code examples demonstrate how to display the X, Y coordinate values and index of the hit point using simple labels.
- Instantiate a FlexChart as shown below.
Razor Copy Code<div id="flexChart1" style="height: 300px"></div> @(Html.C1().FlexChart("#flexChart1") .Bind("Date", Model) .ChartType(C1.Web.Mvc.Chart.ChartType.Column) .Series(sers => sers .Add() .Binding("SalesInUSA") .Name("Sales in USA") ) )
- Add a
<div>tag just below the FlexChart to display the information of the hit point as shown below.Razor Copy Code<div id="info"></div> - Add the following script that retrieves the X, Y coordinate values and index of the hit point and displays them in the division added just below the chart.
JavaScript Copy Code<script type="text/javascript"> c1.mvc.Utils.documentReady(function () { var chart = wijmo.Control.getControl("#flexChart1"), formatHitInfo = function (hitInfo, pt) { var s = '<div><b>Chart element</b>: ' + wijmo.chart.ChartElement[hitInfo.chartElement] + '</div>'; if (hitInfo.series) { s += '<div><b>Series name</b>: ' + hitInfo.series.name; if (hitInfo.pointIndex !== null) { s += '<div><b>Point index</b>: ' + hitInfo.pointIndex + '</div>'; if (hitInfo.chartElement == wijmo.chart.ChartElement.PlotArea) { s += '<div><b>x coordinate</b>: ' + pt.x.toFixed(2) + '</div>'; s += '<div><b>y coordinate</b>: ' + pt.y.toFixed(2) + '</div>'; } } } return s; }; chart.hostElement.onmousemove = function (e) { var hit = chart.hitTest(e); var info = document.getElementById("info"); info.innerHTML = formatHitInfo(hit, chart.pointToData(e)); }; }); </script>