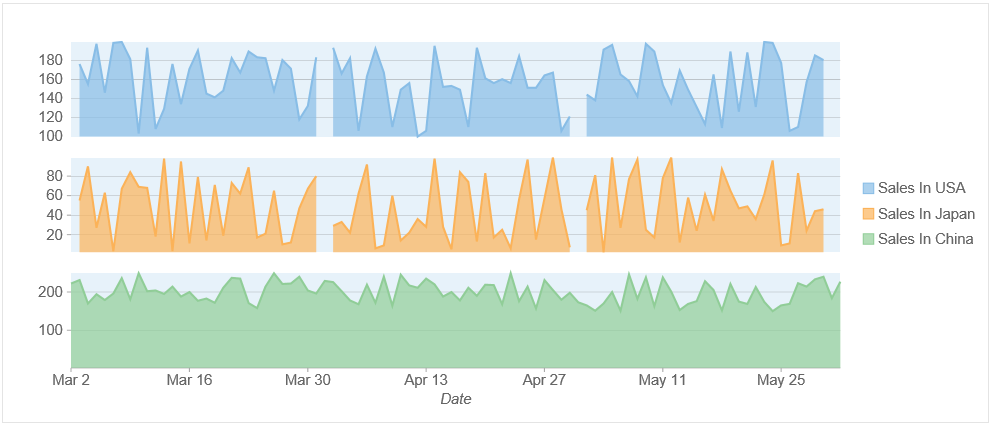
In FlexChart, you can create different plot areas for different series within a single chart area. This increases the viewability of data by displaying each series in a separate plot area across one axis, keeping other axis fixed.
The following image displays a chart that consists of three plot areas across Y axis:
The following code example demonstrates how to create plot areas in FlexChart. This example uses the sample created in the Quick Start section.
| Razor |
Copy Code
|
|---|---|
@using C1MvcWebAppPlotAreas.Models
@model IEnumerable<FruitSale>

<script>
    var flexChart;
    c1.documentReady(function () {
        flexChart = wijmo.Control.getControl('#flexChart');

        addPlotArea(0, "plot1", { fill: 'rgba(136,189,230,0.2)' }, null);
        addPlotArea(1, "div1",null, 20);
        addPlotArea(2, "plot2", { fill: 'rgba(136,189,230,0.2)' }, null);
        addPlotArea(3, "div2", null, 20);
        addPlotArea(4, "plot3", { fill: 'rgba(136,189,230,0.2)' }, null);
        flexChart.series[1].axisY.plotArea = flexChart.plotAreas.getPlotArea('plot2');
        flexChart.series[2].axisY.plotArea = flexChart.plotAreas.getPlotArea('plot3');
    });

    function addPlotArea(row, name, style, height) {
        var plotArea = new wijmo.chart.PlotArea();
        plotArea.row = row;
        plotArea.name = name;
        if (style) {
            plotArea.style = style;
        }

        if (height) {
            plotArea.height = height;
        }

        flexChart.plotAreas.push(plotArea);
    }
</script>

@(Html.C1().FlexChart().Id("flexChart").ChartType(C1.Web.Mvc.Chart.ChartType.Area)
    .CssClass("chart").Bind(Model).BindingX("Date")
    .AxisX(axis => axis.Title("Date"))
    .Series(sers =>
    {
        sers.Add().Binding("SalesInUSA").Name("Sales In USA");
        sers.Add().Binding("SalesInJapan").Name("Sales In Japan").AxisY(axis =>
            axis.Position(C1.Web.Mvc.Chart.Position.Left).MajorGrid(true));
        sers.Add().Binding("SalesInChina").Name("Sales In China").AxisY(axis =>
            axis.Position(C1.Web.Mvc.Chart.Position.Left).MajorGrid(true));
    })
)
|
|