A gradient is a graphical effect that produces a three dimensional color look by blending one color into another. Multiple colors can be used, where one color gradually fades and changes to the other color. Elements or controls using gradient color look better, because the gradient is generated with the help of browser. FlexChart allows you to apply gradient colors to improve the appearance of your chart, with respect to styling.
The gradient descriptor is an expression formatted as follows:
| HTML |
Copy Code
|
|---|---|
<type>(<coords>)<colors>[:<offset>[:<opacity>]][-<colors>[:<offset>[:<opacity>]]]-<colors>[:<offset>[:<opacity>]] |
|
The gradient descriptor includes the following elements.
-
Type - The <type> can be either linear or radial.
- The uppercase L or R letters indicate absolute coordinates offset from the SVG surface.
- The lowercase l or r letters indicate coordinates calculated relative to the element to which the gradient is applied.
-
Coordinates
- Specify a linear gradient vector as x1, y1, x2, y2.
- Specify a radial gradient vector as cx, cy, r, and optional fx, fy, fr specifying a focal point away from the center of the circle.
- Colors - The <colors> is specified as a list of dash-separated CSS color values. Each color may be followed by a custom offset and opacity value, separated with a colon character.
Linear and radial gradient type examples are as follows.
| Linear Gradient Format |
Copy Code
|
|---|---|
'l(0,0,1,0)#ff0000-#00ff00-#0000ff', 'L(0,0,300,300)#ff0000:0.2:0.2-00ff00:0.8' |
|
| Radial Gradient Format |
Copy Code
|
|---|---|
'r(0.5,0.5,1)#ff0000-#0000ff', 'R(100,100,100,200,200,200)#ff0000-#0000ff' |
|
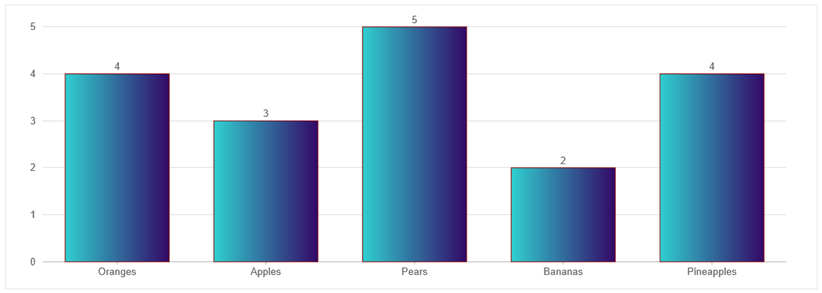
The following code example demonstrates how to add gradient colors in FlexChart. This example uses the Fruit.cs model created in the FlexChart: Quick Start section.
| Razor |
Copy Code
|
|---|---|
@using ChartGradient.Models @model IEnumerable<Fruit> @using C1.Web.Mvc.Chart @(Html.C1().FlexChart().Id("chartGradients") .ChartType(ChartType.Column) .Bind(Model) .BindingX("Name").Legend(Position.None) .DataLabel(label => { label.Content("{y}"); }) .Series(ser => { ser.Add().Name("March").Binding("MarPrice").Style(s => s.Stroke("darkred") .StrokeWidth(1).Fill("l(0, 0, 1, 0)#30cfd0-#330867")); })) |
|