Annotations are used to mark important news or events that can be attached to a specific data point on FinancialChart. Users can hover over the event to display the full annotation text. FinancialChart's Annotation lets a user add different types of annotations on the chart, including text, shapes, images. There are various built-in shapes which are supported as annotations in FlexChart, such as Circle, Ellipse, Image, Line, Polygon, Rectangle, Square and Text.
You can specify the position of annotation on FlexChart by setting the AnnotationPosition property to Bottom, Center, Left, Right or Top. To specify the attachment of annotation in FlexChart, you can use the AnnotationAttachment property, and set its value to:
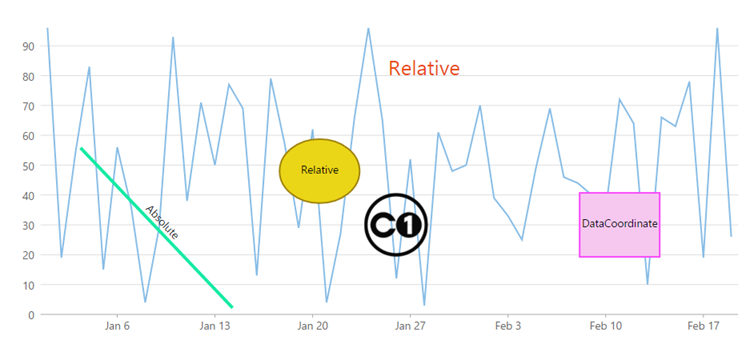
- Absolute: The annotation point is specified in control's pixel coordinates
- DataCoordinate: Annotation point is specified in data coordinates.
- DataIndex: Coordinates of the annotation point are defined by the data series index and the data point index.
- Relative: Annotation point is specified as a relative position inside the control where (0,0) is the top left corner and (1,1) is the bottom right corner.
This section describes how to add annotations to a FlexChart control in an MVC web application.
This topic comprises of three steps:
- Step 1: Create a Datasource for FlexChart
- Step 2: Initialize a FlexChart control and add Annotations to it
- Step 3: Build and Run the Project
The following image shows how FlexChart appears after completing the steps above:
Step 1: Create a Datasource for FlexChart
- Add a new class to the folder Models (for example:
Sale.cs). For more information, see Adding controls to know how to add a new model. - Add the following code to the new model to define the classes that serve as a datasource for the FlexChart control.
C# Copy Codepublic class Sale { public int ID { get; set; } public DateTime Start { get; set; } public DateTime End { get; set; } public string Country { get; set; } public string Product { get; set; } public string Color { get; set; } public double Amount { get; set; } public double Amount2 { get; set; } public double Discount { get; set; } public bool Active { get; set; } public MonthData[] Trends { get; set; } public int Rank { get; set; } private static List<string> COUNTRIES = new List<string> { "US", "UK", "Canada", "Japan", "China", "France", "German", "Italy", "Korea", "Australia" }; private static List<string> PRODUCTS = new List<string> { "Widget", "Gadget", "Doohickey" }; /// <summary> /// Get the data. /// </summary> /// <param name="total"></param> /// <returns></returns> public static IEnumerable<Sale> GetData(int total) { var colors = new[] { "Black", "White", "Red", "Green", "Blue" }; var rand = new Random(0); var dt = DateTime.Now; var list = Enumerable.Range(0, total).Select(i => { var country = COUNTRIES[rand.Next(0, COUNTRIES.Count - 1)]; var product = PRODUCTS[rand.Next(0, PRODUCTS.Count - 1)]; var color = colors[rand.Next(0, colors.Length - 1)]; var startDate = new DateTime(dt.Year, i % 12 + 1, 25); var endDate = new DateTime(dt.Year, i % 12 + 1, 25, i % 24, i % 60, i % 60); return new Sale { ID = i + 1, Start = startDate, End = endDate, Country = country, Product = product, Color = color, Amount = Math.Round(rand.NextDouble() * 10000 - 5000, 2), Amount2 = Math.Round(rand.NextDouble() * 10000 - 5000, 2), Discount = Math.Round(rand.NextDouble() / 4, 2), Active = (i % 4 == 0), Trends = Enumerable.Range(0, 12).Select(x => new MonthData { Month = x + 1, Data = rand.Next(0, 100) }).ToArray(), Rank = rand.Next(1, 6) }; }); return list; } public static List<string> GetCountries() { var countries = new List<string>(); countries.AddRange(COUNTRIES); return countries; } public static List<string> GetProducts() { List<string> products = new List<string>(); products.AddRange(PRODUCTS); return products; } } public class BasicSale { public int Sale { get; set; } public DateTime Date { get; set; } public BasicSale(int sale, DateTime date) { Sale = sale; Date = date; } public static List<BasicSale> GetBasicSales() { List<BasicSale> list = new List<BasicSale>(); int[] sales = { 96, 19, 54, 83, 15, 56, 36, 4, 29, 93, 38, 71, 50, 77, 69, 13, 79, 57, 29, 62, 4, 27, 66, 96, 65, 12, 52, 3, 61, 48, 50, 70, 39, 33, 25, 49, 69, 46, 44, 40, 35, 72, 64, 10, 66, 63, 78, 19, 96, 26}; for (int i = 0; i < sales.Length; i++) { list.Add(new BasicSale(sales[i], new DateTime(2014, i / 31 + 1, i % 31 + 1))); } return list; } }
Step 2: Initialize a FlexChart control and add Annotations to it
Complete the following steps to initialize a FlexChart control and add annotations to it.
Add a new Controller
- In the Solution Explorer, right click the folder Controllers.
- From the context menu, select Add | Controller. The Add Scaffold dialog appears.
- Complete the following steps in the Add Scaffold dialog:
- Select Empty MVC Controller template.
- Set name of the controller (for example:
AnnotationController). - Click Add.
- Replace the method
Index()with the following method.C# Copy Codepublic ActionResult Index() { return View(BasicSale.GetBasicSales()); }
Add a View for the Controller
- From the Solution Explorer, expand the folder Controllers and double click the controller
AnnotationControllerto open it. - Place the cursor inside the method
Index(). - Right click and select Add View. The Add View dialog appears.
- In the Add View dialog, verify that the view name is Index and View engine is Razor (CSHTML).
- Click Add. A view is added for the controller.
- Instantiate a FlexChart control in the view QuickStart as shown below.
The example uses C1logo image to display image annotation for FlexChart. The image is available on your system in C:\Users\<username>\Documents\ComponentOne Samples\Studio for ASP.NET MVC\MVC\MvcExplorer\Content\images\c1logo.png.
Razor Copy Code@using MVCFinancialChart.Models @using C1.Web.Mvc @using C1.Web.Mvc.Chart @using System.Drawing @model IEnumerable<BasicSale> @*Add data to be displayed on tooltip*@ @{ var lineTooltip = "This is line annotation. </br> start: { x: 50, y: 150 } end: { x: 240, y: 350 } </br> attachment: Absolute"; var textTooltip = "This is text annotation.</br> point: { x: 0.55, y: 0.15 }</br> attachment: Relative"; var ellipseTooltip = "This is ellipse annotation.</br> point: { x: 0.4, y: 0.5 }</br> attachment: Relative"; var rectTooltip = "This is rectangle annotation.</br> point:{ x: new DateTime(2014, 2, 11), y: 30 }</br> attachment: DataCoordinate"; var imageTooltip = "This is image annotation.</br> point:{x: new DateTime(2014, 1, 26), y: 30}</br> attachment: DataCoordinate"; } @*Initialize a FlexChart*@ @(Html.C1().FlexChart().Bind(Model) .BindingX("Date").Series(series => { series.Add().Binding("Sale").ChartType(ChartType.Line); }) //Add Annotation layer .AddAnnotationLayer(layer => { //Add line annotation layer.AddLine(line => line.Attachment(AnnotationAttachment.Absolute) .Position(AnnotationPosition.Center) .Content("Absolute") .Start(new DataPoint(50, 150)) .End(new DataPoint(240, 350)) .Tooltip(lineTooltip) .Style(style => style.Stroke("#17EAA5").StrokeWidth(4) )); //Add text annotation layer.AddText(text => text.Attachment(AnnotationAttachment.Relative) .Content("Relative") .Position(AnnotationPosition.Center) .Point(new DataPoint(0.55, 0.15)) .Tooltip(textTooltip) .Style(style => style.Fill("#EA4C17").FontSize(26)) ); //Add ellipse annotation layer.AddEllipse(ellipse => ellipse.Attachment(AnnotationAttachment.Relative) .Position(AnnotationPosition.Center) .Point(new DataPoint(0.4, 0.5)) .Width(100).Height(80) .Content("Relative") .Tooltip(ellipseTooltip) .Style(style => style.Fill("#EAD617").Stroke("#A1840D")) ); //Add rectangle annotation layer.AddRectangle(rectangle => rectangle.Attachment(AnnotationAttachment.DataCoordinate) .Point(new DataPoint(new DateTime(2014, 2, 11), 30)) .Content("DataCoordinate") .Position(AnnotationPosition.Center) .Tooltip(rectTooltip) .Style(style => style.Fill("#F6C8F0").Stroke("#F947FB")) ); //Add image annotation layer.AddImage(image => image.Attachment(AnnotationAttachment.DataCoordinate) .Href("/Content/images/c1logo.png") .Point(new DataPoint(new DateTime(2014, 1, 26), 30)) .Width(80).Height(80) .Tooltip(imageTooltip) ); }) )
Step 3: Build and Run the Project
- Click Build | Build Solution to build the project.
- Press F5 to run the project.
Append the folder name and view name to the generated URL (for example: http://localhost:1234/Annotation/Index) in the address bar of the browser to see the view.