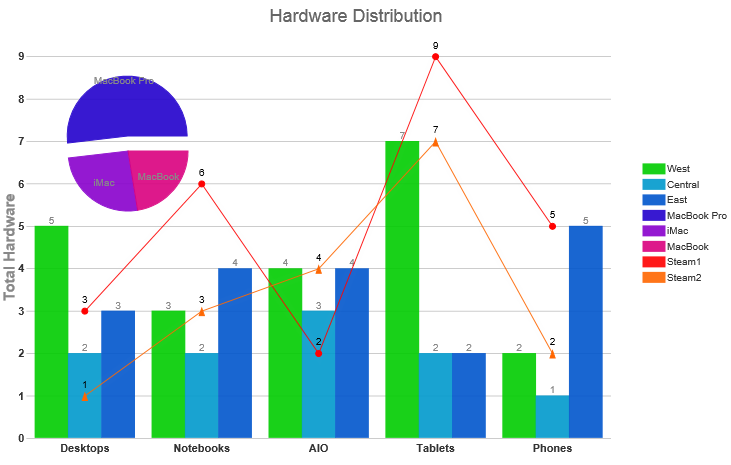
In this step you will run the application and observe the new data and char elements that include titles for the X and Y axis, Chart header, and chart labels.
- Press F5 to run the application.
- Observe the following:
- Hover over any of the chart series and notice a tooltip appears stating the value of the label property, and the Y value of that series.
The tooltip appears when the following code is used:hint: { content: function () { return this.label + '<br/> ' + this.y + ''; } },
- Notice the title for the chart header appears when we used the following code:
header: { text: "Hardware Distribution" }, - Three different types of charts: Pie, Column, and Line appear with several data series for each one.The following code is used to achieve the result:
seriesList: [{ type: "column", label: "West", legendEntry: true, data: { x: ['Desktops', 'Notebooks', 'AIO', 'Tablets', 'Phones'], y: [5, 3, 4, 7, 2] } }, { type: "column", label: "Central", legendEntry: true, data: { x: ['Desktops', 'Notebooks', 'AIO', 'Tablets', 'Phones'], y: [2, 2, 3, 2, 1] } }, { type: "column", label: "East", legendEntry: true, data: { x: ['Desktops', 'Notebooks', 'AIO', 'Tablets', 'Phones'], y: [3, 4, 4, 2, 5] } }, { type: "pie", label: "asdfdsfdsf", legendEntry: true, center: { x: 150, y: 150 }, radius: 60, data: [{ label: "MacBook Pro", legendEntry: true, data: 46.78, offset: 15 }, { label: "iMac", legendEntry: true, data: 23.18, offset: 0 }, { label: "MacBook", legendEntry: true, data: 20.25, offset: 0 }] }, { type: "line", label: "Steam1", legendEntry: true, data: { x: ['Desktops', 'Notebooks', 'AIO', 'Tablets', 'Phones'], y: [3, 6, 2, 9, 5] }, markers: { visible: true, type: "circle" } }, { type: "line", label: "Steam2", legendEntry: true, data: { x: ['Desktops', 'Notebooks', 'AIO', 'Tablets', 'Phones'], y: [1, 3, 4, 7, 2] }, markers: { visible: true, type: "tri" } } ] - The Y-Axis title, “Total Hardware” is applied to the Composite chart and the X-Axis title as an empty string. The following code is used to achieve the result:
axis: {
                y: {
                    text: "Total Hardware"
                },
                x: {
                    text: ""
                }
            },
- Hover over any of the chart series and notice a tooltip appears stating the value of the label property, and the Y value of that series.