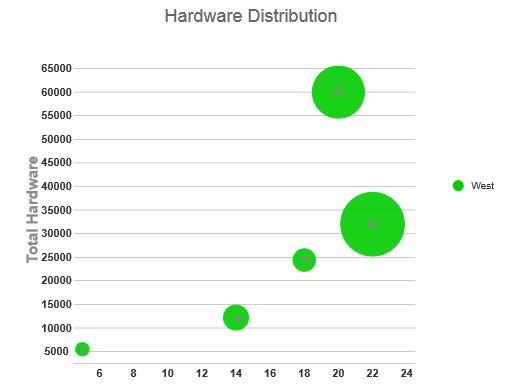
In this step you will run the application and observe the new data and chart elements that include titles for the Y axis, Chart header, and chart labels.
- Press F5 to run the application.
- Observe the following:
- Hover over any of the chart series and notice a tooltip appears stating the value of the X, Y, and Y1 of the Bubble series.
The tooltip appears when the following code is used:hint: { content: function () { return 'x:' + this.x + ',y:' + this.y + ",y1:" + this.data.y1; }
- Notice the title for the chart header appears when we used the following code:
header: { text: "Hardware Distribution" }, - The three data series appear with string X data and numerical Y data. The following code is used to achieve the result:
seriesList: [{ label: "West", legendEntry: true, data: { x: [5, 14, 20, 18, 22], y: [5500, 12200, 60000, 24400, 32000], y1: [3, 12, 33, 10, 42] } // markers: { // type: 'tri' // } }] - The Y-Axis title, “Total Hardware” is applied to the Bubble chart and the X-Axis title as an empty string. The following code is used to achieve the result:
axis: {
                y: {
                    text: "Total Hardware"
                },
                x: {
                    text: ""
                }
            },
- Hover over any of the chart series and notice a tooltip appears stating the value of the X, Y, and Y1 of the Bubble series.