FlexPivotSlicer supports binding with data sources to display sorted, selected and filtered data. A data source can be assigned to the FlexPivotSlicer through the designer as well as code.
Binding FlexPivotSlicer to Data Source at Design-Time
This section highlights how to bind the FlexPivotSlicer control to a data source at design time.
Follow the given steps to bind a FlexPivotSlicer to a data-source:
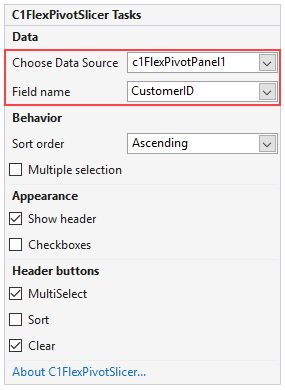
- Add the FlexPivotSlicer control to your application.
- Assign an instance of the already configured FlexPivotPanel to the DataSource property.
- Specify the FieldName that you want to filter using the FieldName property.
Binding FlexPivotSlicer to Data Source with Code
For binding FlexPivotSlicer control with a data source programmatically, you need to initially create an instance of the C1FlexPivotSlicer class. Also, set the Field property of the FlexPivotSlicer control. The Field must be added to one of the following collections: RowFields, ColumnFields, ValueFields, or FilterFields.
The code given below shows how you can add and configure the FlexPivotSlicer control to filter the FlexPivotGrid or FlexPivotChart data by the field ‘Country’.
You can also add multiple FlexPivotSlicer controls and bind them to the desired fields to filter the FlexPivotGrid or FlexPivotChart data by multiple fields simultaneously.
The GIF given below depicts a scenario where multiple FlexPivotSlicer controls can be configured to display the sales of food products in different countries for the last quarter (October, November, and December) within the pivot grid/pivot chart.