To create a Bar chart from an external data source from the client-side, complete the following:
- Add a reference to the C1.Web.Wijmo.Controls.Design.4.dll to your project.
- Add the C1BarChart from the toolbox to your page. For more information on adding the C1BarChart icon to your Toolbox, see Getting Started with ASP.NET Web Forms Edition.
- Click on the Source tab and enter the following code in your source file after the ending body tag:
To write code in Source View
HTML Copy Code<script type = "text/javascript" function hintContent() { return this.data.label + '\n ' + this.y + ''; } $(document).ready(function () { $.support.cors = true; var oData = "http://demo.componentone.com/aspnet/Northwind/northwind.svc/Products?$format=json&$top=10&$orderby=Unit_Price%20desc"; $.ajax({ crossDomain: true, header: { "content-type": "application/javascript" }, url: oData, jsonp: "$callback", success: callback }); }); function callback(result) { // unwrap result var names = []; var prices = []; var products = result["d"]; for (var i = 0; i < products.length; i++) { names.push(products[i].Product_Name); prices.push(products[i].Unit_Price); } $("#<%= C1BarChart1.ClientID %>").c1barchart("option", "seriesList", [ { label: "Prices", legendEntry: true, data: { x: names, y: prices } } ]); }</script>
-
Define the Axis Y Text, Min, Max, and AutoMax, as follows:
To write code in Source View
HTML Copy Code<Axis> <Y Text>="Prices" AutoMin="true" AutoMax="true" Compass="West"></Y> <X Text="Products"></X> </Axis>
-
Define the Header Text and Hint Content, as follows:
To write code in Source View
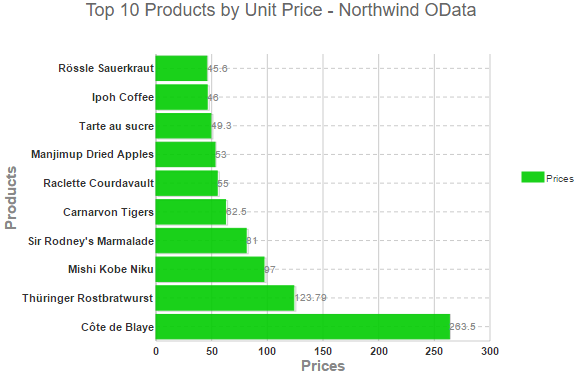
HTML Copy Code<Header> Text="Top 10 Products by Unit Price - Northwind OData"></Header> <Hint><Content Function="hintContent" /> </Hint>
-
Set the BarChart Height to 475 and BarChart Width to 756.
-
Run and build the project.
This topic illustrates the following:
See Also