Trendlines are used to represent trends in data and to examine problems of prediction. Trendlines are commonly used with price charts or financial charts, but they can also be used with a variety of technical analysis charts such as MACD (moving average convergence/divergence) which is a trading indicator used in technical analysis of stock prices, or RSI (relative strength index) which is a technical indicator used in the analysis of financial markets.
Types of Trendlines
The following table displays the supported FitTypes. Each trend type is drawn based on the calculation formula of its type.
| FitType | Description | Preview |
|---|---|---|
| Polynom | A twisted line that is used when data oscillates. It is useful for analyzing gains and losses over a large data set. | 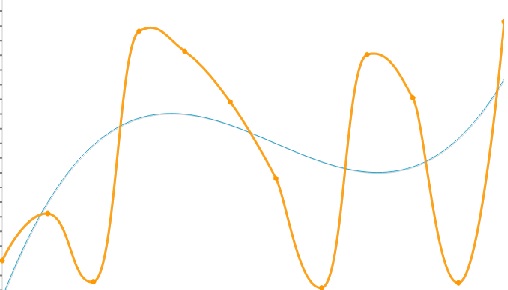 |
| Exponent | A curved line that is convenient to use when data values rise or fall at increasingly higher rates. You cannot create an exponential trendline if your data contains zero or negative values. | 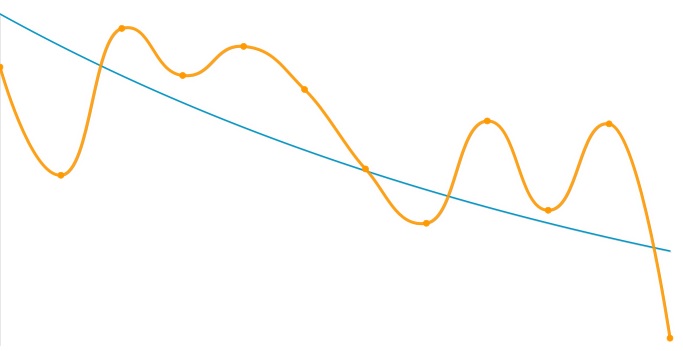 |
| Logarithmic | A best fit curved line used for better visualization of data. Used when the rate of change in the data increases or decreases quickly and then levels out. It can also use positive and negative values. | 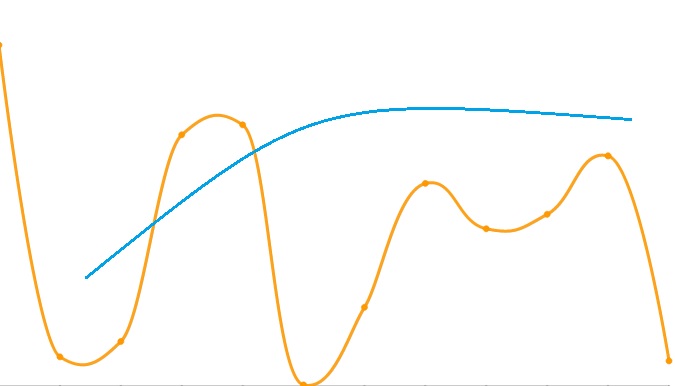 |
| Power | A curved line that is best used with data sets that compare calculation that increase at a peculiar rate. For example, the acceleration of a vehicle at one-second intervals. | 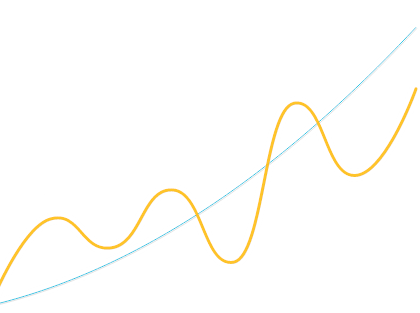 |
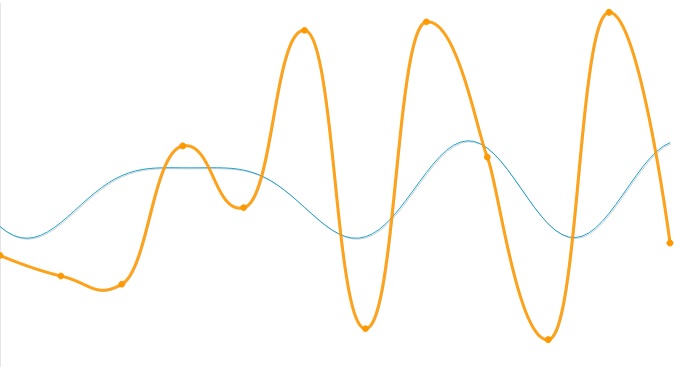
| Fourier | A way to display a wave like function as a combination of simple sine waves. It is created by using the fourier series formula. |
 |
| Min X | Takes the minimum value of X from the chart and draws a trendline using it. | 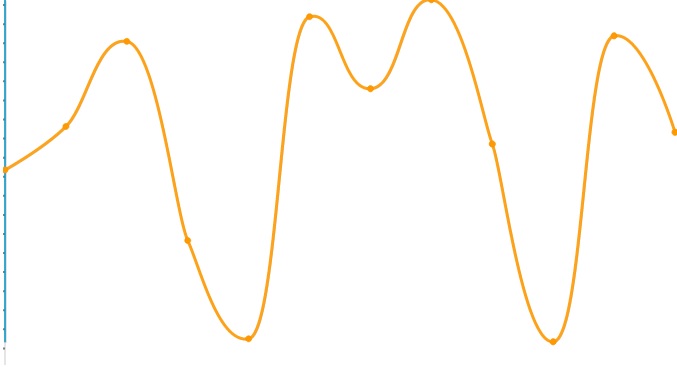 |
| Min Y | Takes the minimum value of Y from the chart and draws a trendline using it | 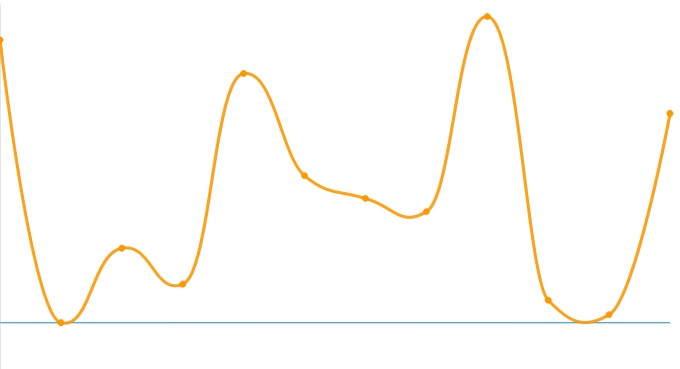 |
| Max X | Takes the maximum value of X from the chart and draws a trendline using it. | 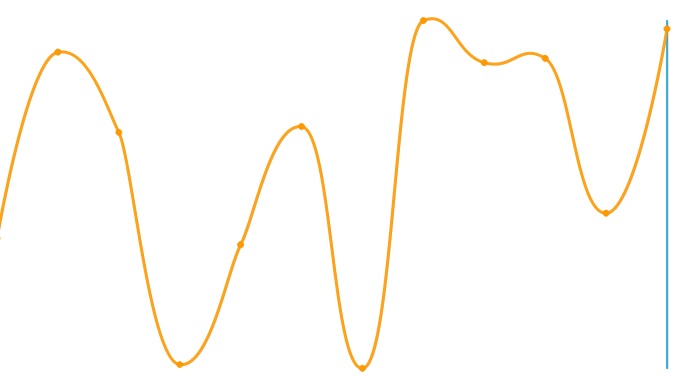 |
| Max Y | Takes the maximum value of Y from the chart and draws a trendline using it. | 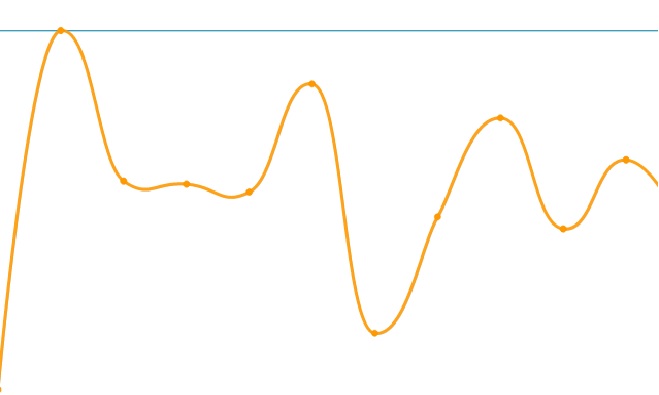 |
| Average X | Calculates the average value of X from the chart data and draws a trendline. | 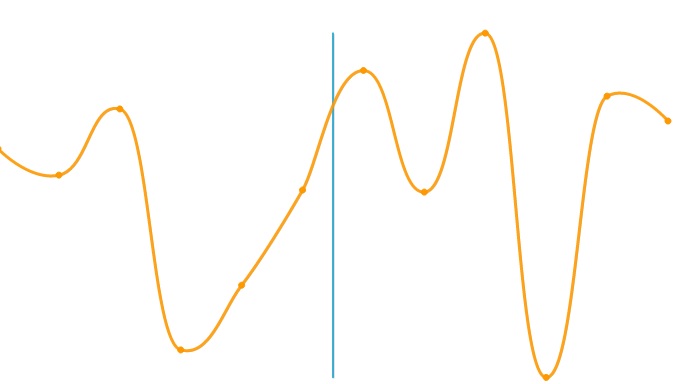 |
| Average Y | Calculates the average value of Y from the chart data and draws a trendline. | 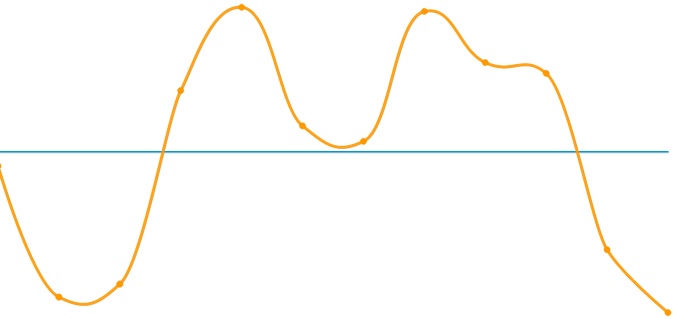 |
TrendLines can be added through the designer, in the source view or even through code. Complete the following steps to add a trendline to a BarChart.
In the Designer
These steps assume that you have already added data to the BarChart. Please see BarChart for ASP.NET Web Forms Quick Start for more information.
- Select the BarChart control and click the smart tag to open the BarChart Tasks Menu.
- Select SeriesList from the BarChart Tasks Menu. The BarChartSeries Collection Editor appears.
- Click the Add button to add a new series. Set the isTrendline property for the new series to True.
- Expand the Trendline Series property group. You will see the following properties.
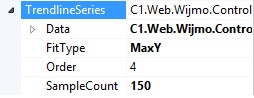
- FitType - Specifies the type of the trendline.
- SampleCount - Specifies the sample count for function calculation for trendline. Note it only works if the FitType is polynom, power, exponent, logarithmic and fourier.
- Order - Specifies the number of terms in polynom equation. It works only if the FitType is set to polynom, power, exponent, logarithmic or fourier.
- FitType - Specifies the type of the trendline.
- Expand the TrendlineSeries.Data property group. Click the ellipses button (...) next to the TrendlineSeries.Data.X.Values property. This will open the ChartXData Collection Editor.
- Enter the values to be displayed on the X axis and click OK.
- Click the ellipses button (...) next to the TrendlineSeries.Data.Y.Values property. This will open the ChartYData Collection Editor.
- Enter the values to be displayed on the Y axis and click OK.
- Set the FitType property, Order property and SampleCount property as per your choice.
- Click OK to close the BarChartSeries Collection Editor.
In Source View
Add the following markup within the <SeriesList></SeriesList> tags, to add a trendline to the chart.
| Markup |
Copy Code
|
|---|---|
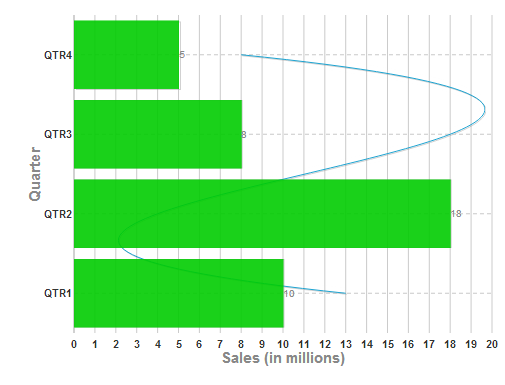
<cc1:BarChartSeries LegendEntry="True" IsTrendline="true"> <TrendlineSeries FitType="Polynom"> <Data> <X> <Values> <cc1:ChartXData StringValue="QTR1" /> <cc1:ChartXData StringValue="QTR2" /> <cc1:ChartXData StringValue="QTR3" /> <cc1:ChartXData StringValue="QTR4" /> </Values> </X> <Y> <Values> <cc1:ChartYData DoubleValue="13" /> <cc1:ChartYData DoubleValue="4" /> <cc1:ChartYData DoubleValue="18" /> <cc1:ChartYData DoubleValue="8" /> </Values> </Y> </Data> </TrendlineSeries> <:/cc1:BarChartSeries> |
|
In Code
Add the following code to the Page_Load event, to add a Trendline to the BarChart Control.
To write code in C#
// Create new series var seriesTrendline = new BarChartSeries(); seriesTrendline.IsTrendline = true; seriesTrendline.Label = "Trendline"; seriesTrendline.TrendlineSeries.FitType = TrendlineFitType.Polynom; seriesTrendline.TrendlineSeries.Order = 4; seriesTrendline.TrendlineSeries.SampleCount = 100; // Add series to the chart this.C1BarChart1.SeriesList.Add(seriesTrendline); // Add X DataseriesTrendline.TrendlineSeries.Data.X.Add("QTR1");
seriesTrendline.TrendlineSeries.Data.X.Add("QTR2");
seriesTrendline.TrendlineSeries.Data.X.Add("QTR3");
seriesTrendline.TrendlineSeries.Data.X.Add("QTR4"); // Add Y Data
seriesTrendline.TrendlineSeries.Data.Y.Add(13);
seriesTrendline.TrendlineSeries.Data.Y.Add(4);
seriesTrendline.TrendlineSeries.Data.Y.Add(18);
seriesTrendline.TrendlineSeries.Data.Y.Add(8);
To write code in Visual Basic
' Create new series
Dim seriesTrendline = New BarChartSeries()
seriesTrendline.IsTrendline = True
seriesTrendline.Label = "Trendline"
seriesTrendline.TrendlineSeries.FitType = TrendlineFitType.Polynom
seriesTrendline.TrendlineSeries.Order = 4
seriesTrendline.TrendlineSeries.SampleCount = 100

' Add series to the chart
Me.C1BarChart1.SeriesList.Add(seriesTrendline)

' Add X Data
seriesTrendline.TrendlineSeries.Data.X.Add("QTR1")
seriesTrendline.TrendlineSeries.Data.X.Add("QTR2")
seriesTrendline.TrendlineSeries.Data.X.Add("QTR3")
seriesTrendline.TrendlineSeries.Data.X.Add("QTR4")

' Add Y Data
seriesTrendline.TrendlineSeries.Data.Y.Add(13)
seriesTrendline.TrendlineSeries.Data.Y.Add(4)
seriesTrendline.TrendlineSeries.Data.Y.Add(18)
seriesTrendline.TrendlineSeries.Data.Y.Add(8)
What You've Accomplished
When you run the project, notice that a blue trendline appears in the BarChart control.