Annotations are used to mark important news or events that can be attached to a specific data point on FlexChart. Annotations can also be used to place arbitrary elements such as images, shapes and text onto the chart. The FlexChart control supports various built-in annotations such as Polygon, Line, Ellipsis, Rectangle, Image and Text.
You can specify the position of an annotation on FlexChart by setting the Position property to Bottom, Center, Left, Right or Top. To specify the attachment of annotation on FlexChart, you can use the Content property and set its value to:
- Absolute: The coordinates of the annotation are specified by the annotation's shape data in pixels.
- DataCoordinate: The coordinates of the annotation are specified in data coordinates.
- DataIndex: The coordinates of the annotation are specified by the data series index and the data point index.
- Relative: The coordinates of the annotation are specified as a relative position within the control, where (0, 0) is the top left corner and (1, 1) is the bottom right corner.
This topic demonstrates how to set various types of annotations on the FlexChart control in three steps:
- Step1: Create a Data Source for FlexChart
- Step 2: Initialize a FlexChart control and add Annotations to it in XAML
- Step 3: Set Bindings in Code
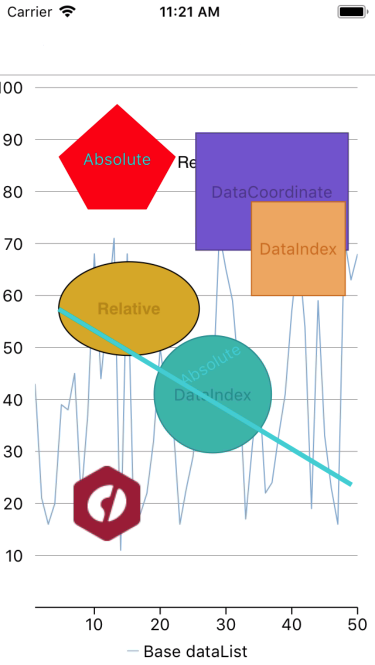
The following image shows how FlexChart control appears after completing the above steps.
Step 1: Create a Data Source for FlexChart
- In the Solution Explorer, right-click your project name (Portable app).
- Select Add | New Item. The Add New Item dialog appears.
- Choose Class from the dialog and provide a name to it, for example ChartSampleData.
- Click Add to add the class to your project.
- Add the following code to the ChartSampleData class.
C# Copy Codeclass ChartSampleData { public class AnnotationViewModel { List<DataItem> _data; List<DataItem> _simpleData; Random rnd = new Random(); public List<DataItem> Data { get { if (_data == null) { _data = new List<DataItem>(); for (int i = 1; i < 51; i++) { _data.Add(new DataItem() { X = i, Y = rnd.Next(10, 80) }); } } return _data; } } public List<DataItem> SimpleData { get { if (_simpleData == null) { _simpleData = new List<DataItem>(); _simpleData.Add(new DataItem() { X = 1, Y = 30 }); _simpleData.Add(new DataItem() { X = 2, Y = 20 }); _simpleData.Add(new DataItem() { X = 3, Y = 30 }); _simpleData.Add(new DataItem() { X = 4, Y = 65 }); _simpleData.Add(new DataItem() { X = 5, Y = 70 }); _simpleData.Add(new DataItem() { X = 6, Y = 60 }); } return _simpleData; } } } public class DataItem { public int X { get; set; } public int Y { get; set; } } }
Step 2: Initialize a FlexChart control and add Annotations to it in XAML
- Right-click your project in the Solution Explorer and select Add | New Item. The Add New Item dialog appears.
- Select Content Page from the installed templates and provide a name to it, for example, Annotations.
- Click Add to add the page to your project.
- Initialize the FlexChart control in the Annotation.xaml page by adding the following XAML code.
XAML Copy Code<ContentPage xmlns="http://xamarin.com/schemas/2014/forms" xmlns:x="http://schemas.microsoft.com/winfx/2009/xaml" xmlns:Chart="clr-namespace:C1.Xamarin.Forms.Chart;assembly=C1.Xamarin.Forms.Chart" xmlns:Annotation="clr-namespace:C1.Xamarin.Forms.Chart.Annotation;assembly=C1.Xamarin.Forms.Chart" x:Class="Annotations.App"> <Chart:FlexChart x:Name="flexChart" BindingX="Name"> <Chart:FlexChart.AxisY> <Chart:ChartAxis Min="0" Max="100" MajorUnit="10" AxisLine="False" MajorGrid="True" MajorTickMarks="None"/> </Chart:FlexChart.AxisY> <Chart:FlexChart.Series> <Chart:ChartSeries SeriesName="Base dataList" Binding="Y" BindingX="X"/> </Chart:FlexChart.Series> <Chart:FlexChart.Layers> <Annotation:AnnotationLayer> <Annotation:AnnotationLayer.Annotations> <Annotation:Text Content="Relative" Location="0.55, 0.15" Attachment="Relative" > <Annotation:Text.AnnotationStyle> <Chart:ChartStyle FontSize="14" Stroke="Black" FontFamily="GenericSansSerif" /> </Annotation:Text.AnnotationStyle> </Annotation:Text> <Annotation:Ellipse Content="Relative" Location="0.4, 0.45" Width="120" Height="80" Attachment="Relative"> <Annotation:Ellipse.AnnotationStyle> <Chart:ChartStyle Fill="Goldenrod"/> </Annotation:Ellipse.AnnotationStyle> <Annotation:Ellipse.ContentStyle> <Chart:ChartStyle Stroke="DarkGoldenrod" FontAttributes="Bold" FontSize="14" FontFamily="GenericSansSerif" /> </Annotation:Ellipse.ContentStyle> </Annotation:Ellipse> <Annotation:Circle Content="DataIndex" Radius="50" SeriesIndex="0" PointIndex="27" Attachment="DataIndex" > <Annotation:Circle.AnnotationStyle> <Chart:ChartStyle Fill="LightSeaGreen" FontSize="14" Stroke="DarkCyan" FontFamily="GenericSansSerif" FontAttributes="Bold" /> </Annotation:Circle.AnnotationStyle> </Annotation:Circle> <Annotation:Rectangle Content="DataCoordinate" Width="130" Height="100" Location="37, 80" Attachment="DataCoordinate"> <Annotation:Rectangle.AnnotationStyle> <Chart:ChartStyle Fill="SlateBlue" FontSize="14" Stroke="DarkSlateBlue" FontFamily="GenericSansSerif" FontAttributes="Bold" /> </Annotation:Rectangle.AnnotationStyle> </Annotation:Rectangle> <Annotation:Square Content="DataIndex" Length="80" SeriesIndex="0" PointIndex="40" Attachment="DataIndex" > <Annotation:Square.AnnotationStyle> <Chart:ChartStyle Fill="SandyBrown" FontSize="14" Stroke="Chocolate" FontFamily="GenericSansSerif" FontAttributes="Bold" /> </Annotation:Square.AnnotationStyle> </Annotation:Square> <Annotation:Polygon x:Name="polygonAnno" Content="Absolute" Attachment="Absolute"> <Annotation:Polygon.AnnotationStyle> <Chart:ChartStyle Fill="Red" StrokeThickness="3" FontSize="14" Stroke="DarkTurquoise" FontFamily="GenericSansSerif" FontAttributes="Bold" /> </Annotation:Polygon.AnnotationStyle> </Annotation:Polygon> <Annotation:Line Content="Absolute" Start="50, 200" End="300, 350" Attachment="Absolute" > <Annotation:Line.AnnotationStyle> <Chart:ChartStyle StrokeThickness="4" FontSize="14" Stroke="DarkTurquoise" FontFamily="GenericSansSerif" FontAttributes="Bold" /> </Annotation:Line.AnnotationStyle> </Annotation:Line> <Annotation:Image Location="12, 20" x:Name="imageAnno" Width="64" Height="64" Attachment="DataCoordinate" /> </Annotation:AnnotationLayer.Annotations> </Annotation:AnnotationLayer> </Chart:FlexChart.Layers> </Chart:FlexChart> </ContentPage>
Step 3: Set Bindings in Code
- In the Solution Explorer, expand the Annotations.xaml node and open the Annotations.xaml.cs to open the C# code behind.
- In the Annotations() class constructor, set the BindingContext for the FlexChart to SampleViewModel and other annotation bindings as illustrated in the code below.
C# Copy Codepublic partial class AnnotationSample : ContentPage { public AnnotationSample() { InitializeComponent(); Title = AppResources.GettingStartedTitle; flexChart.ItemsSource = new AnnotationViewModel().Data; flexChart.ChartType = ChartType.Line; flexChart.BindingX = "X"; flexChart.LegendPosition = ChartPositionType.Bottom; var pngImage = ImageSource.FromResource("<ApplicationName>.Images.butterfly.png"); imageAnno.Source = pngImage; polygonAnno.Points = CreatePoints(); } private System.Collections.ObjectModel.ObservableCollection<Point> CreatePoints() { System.Collections.ObjectModel.ObservableCollection<Point> points = new System.Collections.ObjectModel.ObservableCollection<Point>(); points.Add(new Point(100, 25)); points.Add(new Point(50, 70)); points.Add(new Point(75, 115)); points.Add(new Point(125, 115)); points.Add(new Point(150, 70)); return points; } }