You can add data labels in the FlexChart control to show the exact values corresponding to a particular column, bar or point in the plot area. You can display the data labels at the following positions relative to each plot element.
- Top - on the top of the column, bar or point in the chart area.
- Bottom - below the edge of the column, bar or point in the chart area.
- Right - to the right of the column, bar or point in the chart area.
- Left - to the left of the column, bar or point in the chart area.
- Center - in the center of the column, bar or point in the chart area.
- None - no labels are visible.
The following image shows a column chart with data labels positioned on the top.
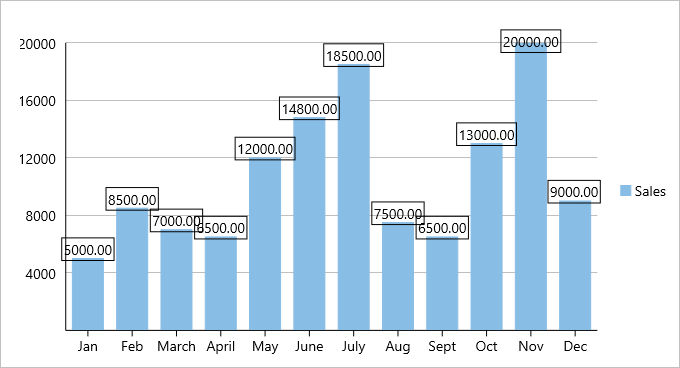
A data label can contain any amount of text and other UI elements. To display data labels in a FlexChart control, you must set the ChartDataLabel.Position property and define the content template to display as the label.
The table below lists the predefined parameters applicable for data label content customization.
| Parameter | Description |
|---|---|
| x | Shows the X value of the data point. |
| y | Shows the Y value of the data point. |
| value | Shows the Y value of the data point. |
| name | Shows the X value of the data point. |
| seriesName | Shows the name of the series. |
| pointIndex | Shows the index of the data point. |
| Percentage | Shows the percentage of a pie slice to the whole pie chart. |
In XAML
The following code example demonstrates how to use data labels in FlexChart and set their position. This examples uses the sample created in the Quick Start section.
| XAML |
Copy Code |
|---|---|
<c1:FlexChart.DataLabel> <c1:ChartDataLabel Position="Top" Border="True" Content="{}{value:F2}"/> </c1:FlexChart.DataLabel> | |
In Code
To add the content and change the label position in code, use the following code.
| C# |
Copy Code |
|---|---|
//Setting the data labels chart.DataLabel.Content = "{}{value:F2}"; chart.DataLabel.Position = ChartLabelPosition.Top; | |
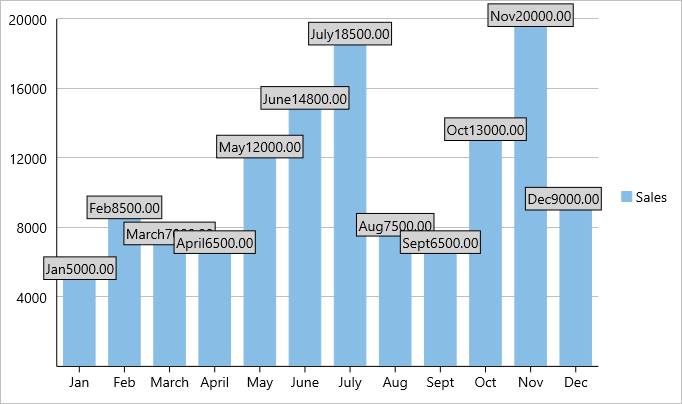
To display the X and Y values in a single label you would add two Labels to the data label template as shown below. You can also customize the appearance of the data labels.
In XAML
| XAML |
Copy Code |
|---|---|
<c1:FlexChart.DataLabel> <c1:ChartDataLabel Border="True" Position="Top" Content="{}{x}{value:F2}"> <c1:ChartDataLabel.Style> <c1:ChartStyle FontSize="14" Fill="LightGray"></c1:ChartStyle> </c1:ChartDataLabel.Style> </c1:ChartDataLabel> </c1:FlexChart.DataLabel> | |
In Code
| C# |
Copy Code |
|---|---|
chart.DataLabel.Content = "{}{x}{value:F2}";
chart.DataLabel.Position = ChartLabelPosition.Top;
chart.DataLabel.Style.Fill = Color.LightGray;
chart.DataLabel.Style.FontSize = 14; | |
The image below show how the X and Y values appear in a single label.