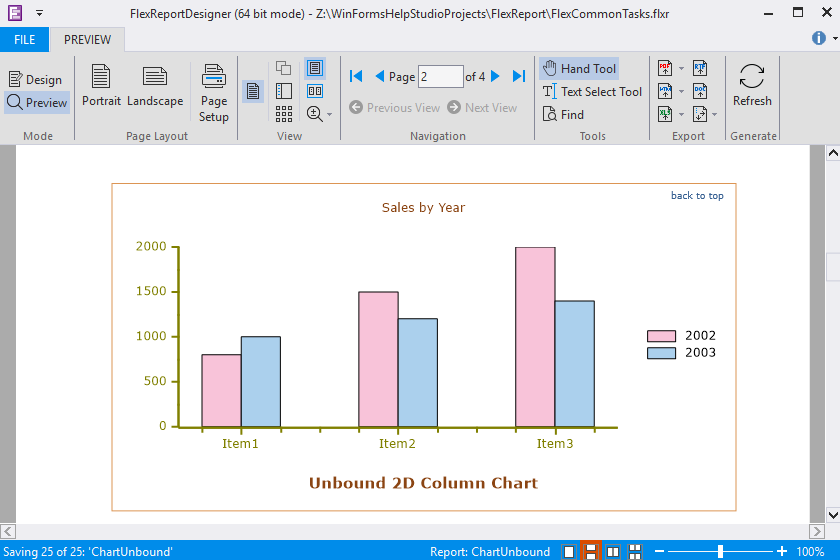
FlexReport allows you to add data to the charts without binding the charts to a data source. You can plot series on chart and display it by setting an array of X and Y values directly in unbound mode. Let us add an unbound 2D chart by performing the following steps:
- In the C1FlexReportDesigner application, create a new report by navigating through the C1FlexReport wizard or open an existing report definition.
- Add Chart field to the Detail section.
Note: To add Legacy Chart field to your report, you need to add it to the INSERT tab. In order to do that, go to File|Options in the designer and select Show "Legacy Chart" button on the INSERT tab.
- In Properties window, expand ChartGroups|Group0|ChartType and select a type of chart from the ChartType dropdown. In our case, we have selected Bar chart type.
- Navigate to ChartGroups|Group0|ChartData and click the ellipsis button next to UnboundSeriesList property.
- In the ChartUnboundDataSeries Collection Editor, add any number of series you want to plot in chart. Here, we have added two series.
- Select one of the series and click the ellipsis button next to SeriesData property.
- In the editor for series data, enter your data.
- Click OK to close the editors.
- Click the Preview button to switch to Preview mode to view the report.
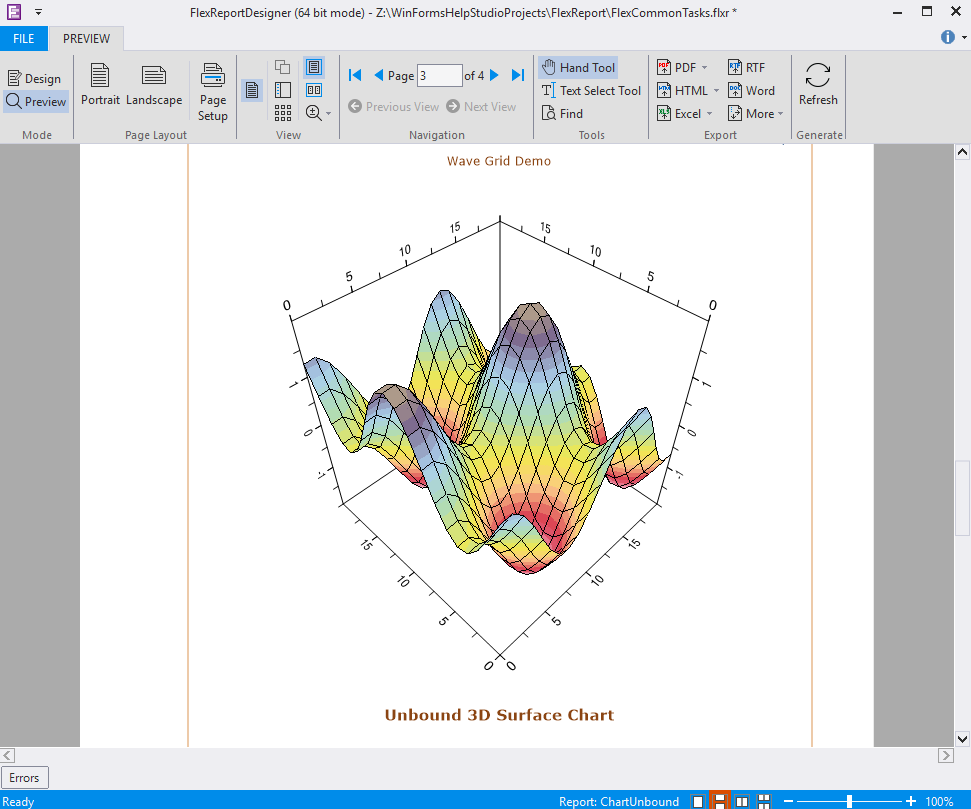
For 3D unbound chart, perform the following steps:
- Add Chart field to the Detail section.
- In Properties window, expand ChartGroups|Group0|ChartType and select a type of chart from the ChartType dropdown. In our case, we have selected Surface chart type.
- Navigate to ChartGroups|Group0|ChartData|UnboundData|GridSet.
- Set the ColumnCount and RowCount properties to the desired value, if required. In our case, both ColumnCount and RowCount properties are set to 0.
- Click the ellipsis button next to the GridData property.
- In Single Array Editor, enter data and close it.
- Click the Preview button to switch to Preview mode to view the report.