The Chart field in FlexReport provides design-time support through design-time editors and collection editors that simplify working with the charts.
The design-time editors for Chart field are as follows:
- Chart Properties
- Chart Data Source
- Chart Visual Effects
These editors can be invoked by right-clicking the chart field and selecting the required editor.
- Chart Properties
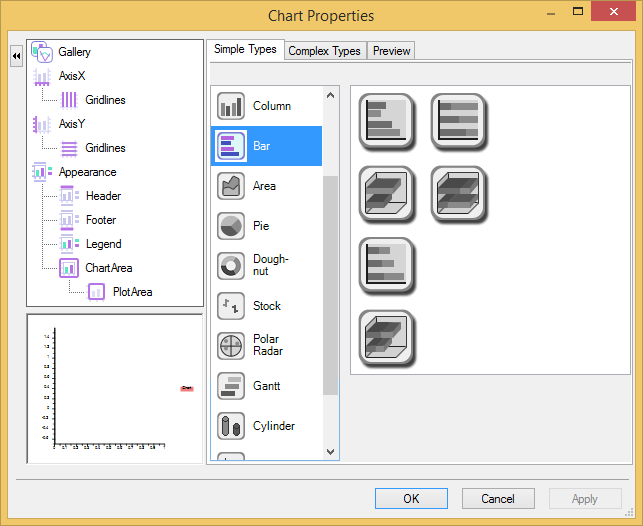
It provides an easy and interactive way to create and modify a new or existing chart. It contains the options to select the type of chart and . However, it also includes additional property settings for the x and y axis along with appearance settings for the header, footer, legend, chart area, and plot area of the chart. The Chart Properties dialog box provides more options to address specific details with the design of the chart you are developing. It consists of following elements:
- Gallery Item: The Gallery item in the left pane of the Chart Properties dialog box provides options for choosing a chart type and/or a sub-type of a chart. To see a description of all chart type selections, see Chart Types. You can choose from a variety of simple chart types or you could click on complex types to add more functionality to your chart.
- Simple Types Tab: In the Simple Types tab you can choose from one of many simple chart types and then you can select a specialized chart located in list box next to the simple chart types.
- Complex Types Tab: In the Complex Types tab you can specify whether you want to chart one or two chart groups. Also, you can select the type of chart you would like to create in the drop-down box for each group. For each group, you have the option to make the groups stacked and/or 3D.
- Chart Data Source
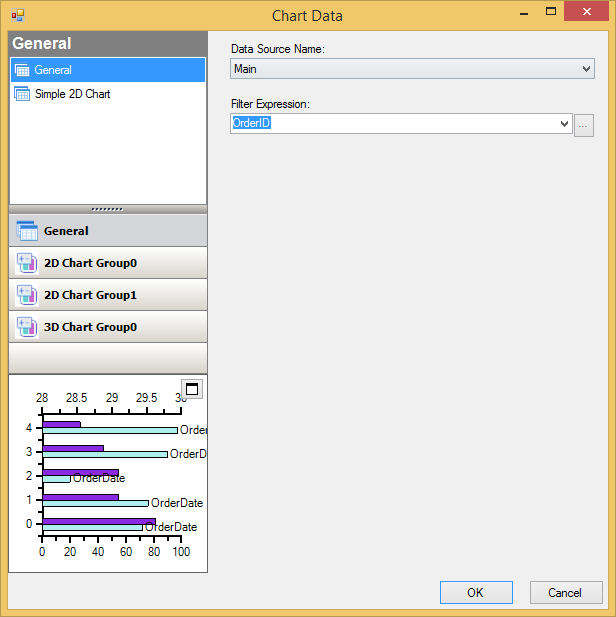
The Chart Data editor lets you bind the chart by setting data through Chart Data-add or remove data series in your chart, specify the label and color of each data series, and stack your data by checking the Show stacked data check box.
- Chart Visual Effects
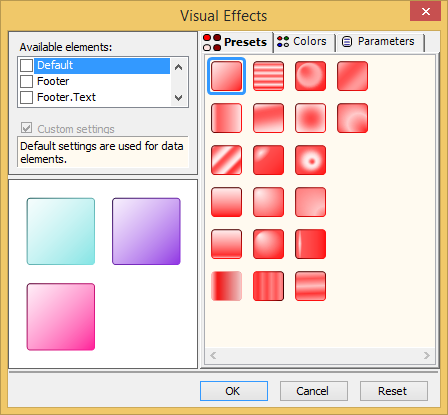
Visual Effects is a tool used for visually enhancing the Chart2D control's elements such as the data series, header, and footer. Any existing project can use the new features provided by this tool. The chart's appearance can dramatically improve in a few simple steps using the Visual Effects designer.
The collection editors for Chart field are as follows:
- ValueLabel Collection Editor: This collection editor can be assessed through the Property pane-ChartArea|AxisX|ValueLabels. For more information, see the documentation on ValueLabel CollectionEditor.
- ChartDataSeries Collection Editor: This collection editor can be assessed through the Property pane-ChartGroups|Group0|ChartData|CategoryGroups. For more information, see the documentation on ChartDataSeries CollectionEditor.
- ChartLabel Collection Editor: This collection editor can be assessed through the Property pane-ChartLabels|DefaultLabelStyle|LabelsCollection. For more information, see the documentation on LabelCollection Editor.
- ChartVisualEffectsStyle Collection Editor: This collection editor can be assessed through the Property pane-VisualEffects|Styles. For more information, see the documentation on VisualEffectsStyle Collection Editor.