Sometimes you need to create charts that have multiple data sets or multiple series. To create such charts, the values for each series are required to be set.
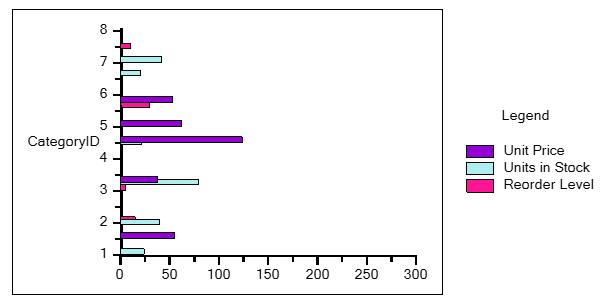
Consider an example of Products table from C1Nwind.mdb database, where you want to view Unit Price, Units in Stock, and Reorder Level corresponding to the Category IDs. The steps to achieve this scenario are as follows:
- Right-click the Chart field and select Chart Data Source .
- Click 2DChartGroup0 and then click Series Values.
- Click the plus glyph and specify Series Label of your choice and Values from the drop-down list. You can also add colors to the series from the Fill option in Style tab. In this case, the data specified for our multiple-series chart is as follows:
Series Label Values Style | Fill Unit Price UnitPrice Blue Voilet Units in Stock UnitsinStock Pale Turquoise Reorder Level ReorderLevel Deep Pink
-
To create Legend:
- Right-click Legacy Chart field.
- Select Chart Properties.
- Navigate to Appearance | Legend.
- Select the Visible checkbox and write “Legend” as Text.