FlexReport for WinForms allows you to create reports with multiple groups. For example, instead of listing all products in a single flat report, you could group products by category. Each group has a header and a footer section that allow you to display information about the group, including titles and subtotals, for example.
If you add a chart to a group header, the chart will display only the data for the current group. By contrast, adding a chart to the report header or footer would include all the data in the report.
To illustrate this, here is a diagram depicting a report definition as shown in the report designer and showing the effect of adding a Chart field to the report header and to a group header:
|
Report Header section A chart field here would generate |
|
Page Header section |
|
Group Header section (CategoryName) A chart field here would generate |
|
Detail section |
|
Group Footer section (CategoryName) |
|
Page Footer section |
|
Report Footer section |
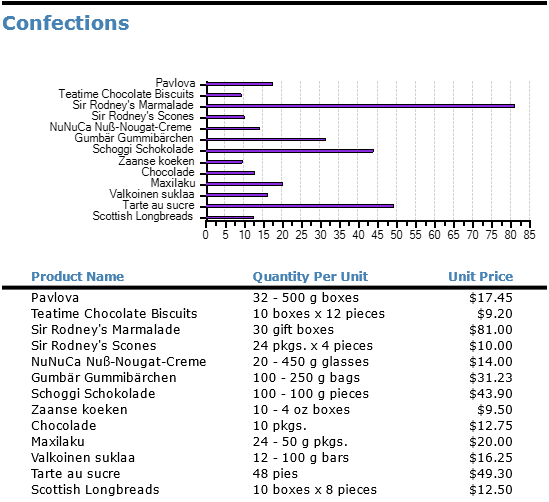
Continuing with the example mentioned above, lets visualize the report data for each category through chart.
Add a Legacy Chart field to the Group Header section (Category Name) and create the chart as explained in the topic Plotting Data in Charts. Specify X and Y values of the chart as ProductName and UnitPrice and specify Value in Series Values as UnitPrice.
The images below show screenshots of the report described above with the group headers, the charts they contain, and a few detail records to illustrate:
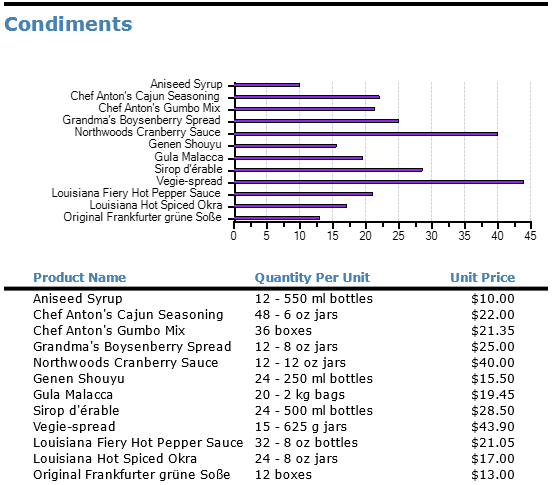
The chart above shows unit prices for products in the "Condiments" category. The chart below shows unit prices for products in the "Confections" category.