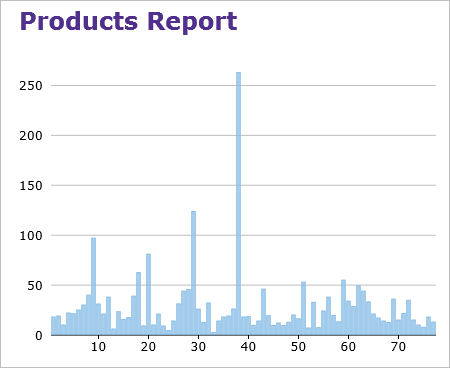
When you add the FlexChart field to your report, you need to bind it to data for populating data in the displayed chart, say Column chart, as shown below. The following steps show how to bind the FlexChart field with data in FlexReportDesigner application.
- Create a new report in C1FlexReportDesigner.
- In Data tab, bind the Main data source with Products table of C1Nwind.mdb database.
- Under INSERT tab, select FlexChart field and draw it in the Header section.
- Select the FlexChart.
- In the Properties window, set the desired Chart Type, say Column chart, from ChartType dropdown.
- Navigate to Series and click the ellipsis button next to it.
- In the Series Collection Editor, click Add button to add a series data group.
- Navigate to Data and set the DataSourceName as Main.
- Set Label as ProductID.
- Set XExpression to ProductID.
- Set YExpression to UnitPrice.
- Close the Editor.
- Click on Preview.
