When you add a Chart field to your report, the first step is to bind the chart to a data source.
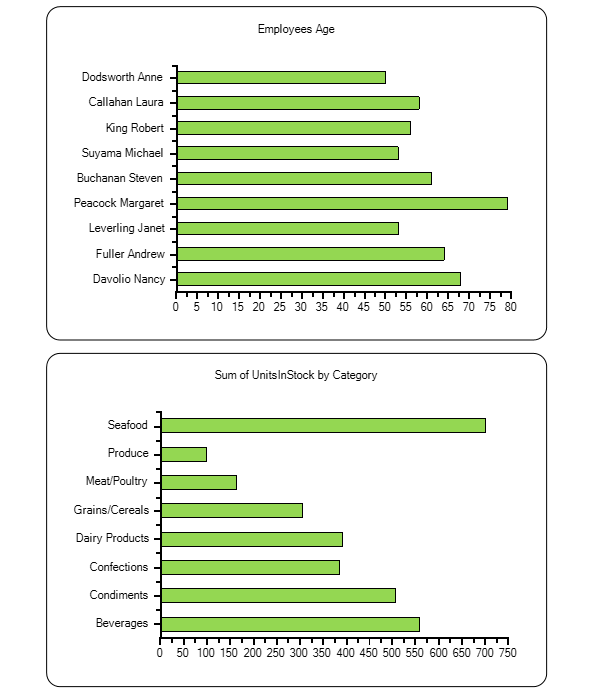
Let's say your report has two data sources, 'Employees' and 'Products'. You want to create two charts, one that displays FullName and Age from Employees data source, and other that displays CategoryName and Sum(UnitsInStock) from Products data source.
The steps to achieve this scenerio are as follows:
- Create two data sources ("Employees", "Products") in the report.
- Define two calculated fields ("FullName", "Age") in Employees data source.
- Define two calculated fields ("CategoryName", "Sum(UnitsInStock)") in Products data source.
- Create two chart fields which bind to "Employees" and "Products" data sources separately.
The following code illustrates the scenerio:
Private report As C1FlexReport
    Private Function CreateChartSampleReport() As C1FlexReport
        report = New C1FlexReport() With { _
            .ReportName = "ChartSample" _
        }
        ' add data source "Employees"
        Dim dsEmployees = New DataSource() With { _
            .Name = "Employees", _
            .ConnectionString = "Provider=Microsoft.Jet.OLEDB.4.0;Data Source=..\..\Reports\C1Nwind.mdb;Persist Security Info=False", _
            .DataSource = "Select * from Employees" _
        }
        report.DataSources.Add(dsEmployees)
        ' add calculated field "FullName".
        Dim calcFullName = New CalculatedField("FullName", GetType(String), "=LastName & "" "" & FirstName")
        dsEmployees.CalculatedFields.Add(calcFullName)
        ' add calculated field "Age".
        Dim calcAge = New CalculatedField("Age", GetType(Integer), "=Year(Now())-Year(BirthDate) + 1")
        dsEmployees.CalculatedFields.Add(calcAge)
        ' add data source "Products"
        Dim dsProducts = New DataSource() With { _
            .Name = "Products", _
            .ConnectionString = "Provider=Microsoft.Jet.OLEDB.4.0;Data Source=..\..\Reports\C1Nwind.mdb;Persist Security Info=False", _
            .RecordSource = "Select Products.CategoryID as CategoryID, Categories.CategoryName as CategoryName, Products.UnitsInStock as UnitsInStock from Products inner join Categories on Products.CategoryID = Categories.CategoryID" _
        }
        report.DataSources.Add(dsProducts)
        report.Sections.Header.Visible = True
        ' add ChartField using Employees data source.
        Dim sectionEmployees = report.Sections.Header.SubSections.Add()
        sectionEmployees.Name = "ChartWithEmployees"
        sectionEmployees.Height = 5200
        sectionEmployees.Visible = True
        sectionEmployees.Fields.Add(CreateChartForEmployees())
        ' add ChartField using Products data source.
        Dim sectionProducts = report.Sections.Header.SubSections.Add()
        sectionProducts.Name = "ChartWithProducts"
        sectionProducts.Height = 5200
        sectionProducts.Visible = True
        sectionProducts.Fields.Add(CreateChartForProducts())
        Return report
    End Function
    Private Function CreateChartForEmployees() As ChartField
        Dim chart = CreateChartField("Chart1", "Employees")
        chart.Header.Text = "Employees Age"
        chart.ChartArea2D.Inverted = True
        chart.ChartArea2D.AxisX.OnTop = True
        Dim group = chart.ChartGroups2D.Group0
        group.ChartType = Chart2DType.Bar
        Dim data = group.ChartData
        data.IsForEachRecord = True        ' show value of each record in data source
        data.CategoryGroups.AddNewGroup("=FullName")        ' group by FullName
        Dim seriesTemplate = data.SeriesValues.AddNewSeries()
        seriesTemplate.DataValues.AddNewValue("=Age")        ' show Age in AxisY
        Return chart
    End Function
    Private Function CreateChartForProducts() As ChartField
        Dim chart = CreateChartField("Chart2", "Products")
        chart.Header.Text = "Sum of UnitsInStock by Category"
        chart.ChartArea2D.Inverted = True
        chart.ChartArea2D.AxisX.OnTop = True
        Dim group = chart.ChartGroups2D.Group0
        group.ChartType = Chart2DType.Bar
        Dim data = group.ChartData
        Dim categoryGroup = data.CategoryGroups.AddNewGroup("=CategoryID")
        ' group by each CategoryID
        categoryGroup.LabelExpression = "=CategoryName"  ' show the CategoryName in AxisX
        Dim seriesTemplate = data.SeriesValues.AddNewSeries()
        seriesTemplate.DataValues.AddNewValue("=Sum(UnitsInStock)")
        ' show sum of UnitsInStock in AxisY
        Return chart
    End Function
    Private Function CreateChartField(name As String, datasource As String) As ChartField
        Dim chart = New ChartField() With { _
            .Name = name, _
             .Width = 7500, _
            .Height = 5000, _
             .Top = 100, _
             .Left = 100, _
             .DataSource = datasource _
        }
        chart.Border.Color = Color.Black
        chart.Border.Width = 15
        chart.Border.Style = DashStyle.Solid
        chart.Border.CornerRadius = New CornerRadius(200.0)
        chart.ChartArea2D.AxisY.AutoMin = False
        Return chart
    End Function
    Private Sub Button1_Click(sender As Object, e As EventArgs) Handles Button1.Click
        CreateChartSampleReport()
        C1FlexViewer1.DocumentSource = report
    End Sub
 private C1FlexReport CreateChartSampleReport()
        {

           var report = new C1FlexReport { ReportName = "ChartSample" };
            // add data source "Employees"
            var dsEmployees = new DataSource
            {
                Name = "Employees",
                ConnectionString =
                    @"Provider=Microsoft.Jet.OLEDB.4.0;Data Source=..\..\Reports\C1Nwind.mdb;Persist Security Info=False",
                RecordSource = "Select * from Employees",
            };
            report.DataSources.Add(dsEmployees);
            // add calculated field "FullName".
            var calcFullName = new CalculatedField("FullName", typeof(string), "=LastName & \" \" & FirstName");
            dsEmployees.CalculatedFields.Add(calcFullName);

            // add calculated field "Age".
            var calcAge = new CalculatedField("Age", typeof(int), "=Year(Now())-Year(BirthDate) + 1");
            dsEmployees.CalculatedFields.Add(calcAge);
            // add data source "Products"
            var dsProducts = new DataSource
            {
                Name = "Products",
                ConnectionString =
                    @"Provider=Microsoft.Jet.OLEDB.4.0;Data Source=..\..\Reports\C1Nwind.mdb;Persist Security Info=False",
                RecordSource =
                    "Select Products.CategoryID as CategoryID, Categories.CategoryName as CategoryName, Products.UnitsInStock as UnitsInStock from Products inner join Categories on Products.CategoryID = Categories.CategoryID"
            };
            report.DataSources.Add(dsProducts);
            report.Sections.Header.Visible = true;
            // add ChartField using Employees data source.
            var sectionEmployees = report.Sections.Header.SubSections.Add();
            sectionEmployees.Name = "ChartWithEmployees";
            sectionEmployees.Height = 5200;
            sectionEmployees.Visible = true;
            sectionEmployees.Fields.Add(CreateChartForEmployees());
            // add ChartField using Products data source.
            var sectionProducts = report.Sections.Header.SubSections.Add();
            sectionProducts.Name = "ChartWithProducts";
            sectionProducts.Height = 5200;
            sectionProducts.Visible = true;
            sectionProducts.Fields.Add(CreateChartForProducts());

            return report;
        }

        private ChartField CreateChartForEmployees()
        {
            var chart = CreateChartField("Chart1", "Employees");
            chart.Header.Text = "Employees Age";
            chart.ChartArea2D.Inverted = true;
            chart.ChartArea2D.AxisX.OnTop = true;
            var group = chart.ChartGroups2D.Group0;
            group.ChartType = Chart2DType.Bar;
            var data = group.ChartData;
            data.IsForEachRecord = true; // show value of each record in data source
            data.CategoryGroups.AddNewGroup("=FullName"); // group by FullName
            var seriesTemplate = data.SeriesValues.AddNewSeries();
            seriesTemplate.DataValues.AddNewValue("=Age"); // show Age in AxisY
            return chart;
        }
        private ChartField CreateChartForProducts()
        {
            var chart = CreateChartField("Chart2", "Products");
            chart.Header.Text = "Sum of UnitsInStock by Category";
            chart.ChartArea2D.Inverted = true;
            chart.ChartArea2D.AxisX.OnTop = true;
            var group = chart.ChartGroups2D.Group0;
            group.ChartType = Chart2DType.Bar;
            var data = group.ChartData;
            var categoryGroup = data.CategoryGroups.AddNewGroup("=CategoryID"); // group by each CategoryID
            categoryGroup.LabelExpression = "=CategoryName"; // show the CategoryName in AxisX.
            var seriesTemplate = data.SeriesValues.AddNewSeries();
            seriesTemplate.DataValues.AddNewValue("=Sum(UnitsInStock)"); // show sum of UnitsInStock in AxisY.
            return chart;
        }
        private ChartField CreateChartField(string name, string datasource)
        {
            var chart = new ChartField
            {
                Name = name,
                Width = 7500,
                Height = 5000,
                Top = 100,
                Left = 100,
                DataSource = datasource,
            };
            chart.Border.Color = Color.Black;
            chart.Border.Width = 15;
            chart.Border.Style = DashStyle.Solid;
            chart.Border.CornerRadius = new CornerRadius(200d);
            chart.ChartArea2D.AxisY.AutoMin = false;
            return chart;
        }
private void button1_Click(object sender, EventArgs e)
        {
            CreateChartSampleReport();
            c1FlexViewer1.DocumentSource = report;
        }