ComponentOne FlexChart for WinForms
Text Annotation
FlexChart > Working with FlexChart > FlexChart Elements > Annotations > Types of Annotations > Text Annotation

Text annotations let you add additional information at specific data points to make the data informative. FlexChart lets you add single line as well as multiline text in text annotations.

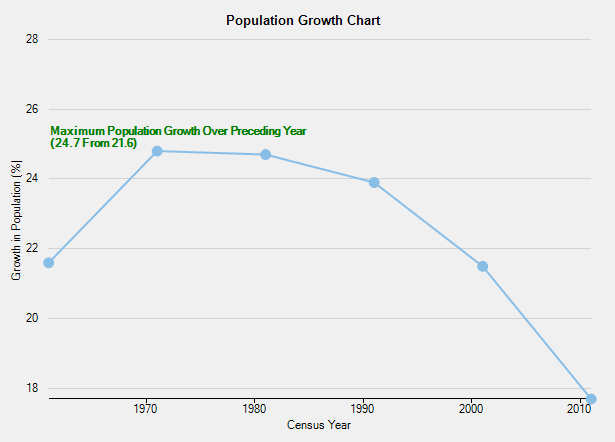
The following image shows the Text annotation displaying the maximum population growth rate between 1961 and 2011.

To work with text annotation in FlexChart, create an instance of the Text class and set the Content property for the instance.

The following code compares population growth rates at specific years in five consecutive decades. The code shows how to add, position, and customize the Text annotation in FlexChart.

' create an instance of the Line annotation
Dim text As New C1.Win.Chart.Annotation.Text()

' specify the line content 
text.Content = "Maximum Population Growth Over Preceding Year" + Environment.NewLine + "(24.7 From 21.6)"

' specify the start and end points of the line
text.Location = New PointF(1961.0F, 25.15F)

' specify the line attachment
text.Attachment = C1.Chart.Annotation.AnnotationAttachment.DataCoordinate

' set the line position
text.Position = C1.Chart.Annotation.AnnotationPosition.Top

' customize the line style and content style
text.Style.StrokeColor = Color.Green
text.Style.Font = New System.Drawing.Font(FontFamily.GenericSansSerif, 8, FontStyle.Bold)

' add the line to the Annotations collection of the annotation layer
annotationLayer.Annotations.Add(text)
// create an instance of the Line annotation
C1.Win.Chart.Annotation.Text text = new C1.Win.Chart.Annotation.Text();

// specify the line content 
text.Content = "Maximum Population Growth Over Preceding Year" + Environment.NewLine + "(24.7 From 21.6)";

// specify the start and end points of the line
text.Location = new PointF(1961F,25.15F);

// specify the line attachment
text.Attachment = C1.Chart.Annotation.AnnotationAttachment.DataCoordinate;

// set the line position
text.Position = C1.Chart.Annotation.AnnotationPosition.Top;

// customize the line style and content style
text.Style.StrokeColor = Color.Green;
text.Style.Font = new System.Drawing.Font(FontFamily.GenericSansSerif, 8, FontStyle.Bold);

// add the line to the Annotations collection of the annotation layer
annotationLayer.Annotations.Add(text);