Depending upon the requirements, you may need to customize the appearance of series in the chart.
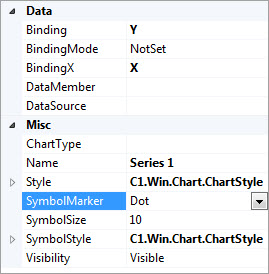
FlexChart allows you to customize series in the chart with the SymbolMarker, SymbolSize, and SymbolStyle properties located in Series Collection Editor.
Refer to Series Collection Editor for more information.
The SymbolMarker property allows you to set the shape of the marker to be used for each data point in the series. The SymbolSize property enables you to set the size (in pixels) of the symbols used to render the series. And the SymbolStyle property allows you to set the fill color, font, stroke color, and stroke width of the symbols used in the series.
Below is a table that lists how these properties affect each chart type:
| Value | Effect for SymbolMarker | Effect for SymbolSize | Effect for SymbolStyle |
|---|---|---|---|
| ChartType.Column | No effect | No effect | No effect |
| ChartType.Bar | No effect | No effect | No effect |
| ChartType.Line | No effect | No effect | No effect |
| ChartType.Scatter | Changes the symbol marker | Changes the symbol size | Changes the symbol style |
| ChartType.LineSymbols | Changes the symbol marker | Changes the symbol size | Changes the symbol style |
| ChartType.Area | No effect | No effect | No effect |
| ChartType.Spline | No effect | No effect | No effect |
| ChartType.SplineSymbols | Changes the symbol marker | Changes the symbol size | Changes the symbol style |
| ChartType.SplineArea | No effect | No effect | No effect |
| ChartType.Bubble | Changes the symbol marker | No effect | Changes the symbol style |
| ChartType.Candlestick | No effect | Changes the symbol size | No effect |
| ChartType.HighLowOpenClose | No effect | Changes the symbol size | No effect |
The SymbolSize property has no effect on the Bubble Chart; however, you can change the size of the bubble in the Bubble Chart by setting the BubbleMaxSize and the BubbleMinSize property located in the Options node of the Properties window.