Sunburst, also known as a multi-level pie chart, is ideal for visualizing multi-level hierarchical data depicted by concentric circles.The circle in the center represents the root node, with the data moving outside from the center. A section of the inner circle supports a hierarchical relationship to those sections of the outer circle which lie within the angular area of the parent section.
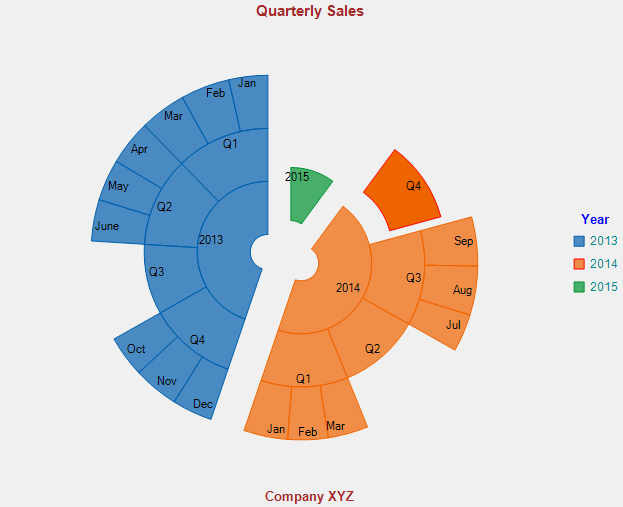
Using Sunburst chart helps the end user to visualize the relationship between outer rings and inner rings. For instance, you might want to display sales report for each quarter of three years. Using SunBurst chart, a sales report of a specific month can be highlighted, thereby depicting relationship with the respective quarter.
Both Sunburst chart and TreeMap chart are ideal for displaying and visualizing hierarchical data, but Sunburst chart is a better visualization tool to show hierarchical levels between the largest category in a data set and each respective data point as it paints a better picture of hierarchy. Whereas, Treemap is preferred when space is a constraint as it can show humongous data in a limited area.
To explore the features of the Sunburst chart, click the following links: