ComponentOne FlexChart for WinForms
SplineSymbols
FlexChart > Understanding FlexChart > FlexChart Types > SplineSymbols

The SplineSymbols Chart combines the Spline Chart and the Scatter Chart. The chart plots data points by using symbols and connects those data points by using splines.

To create the SplineSymbols Chart, you can set the ChartType property to SplineSymbols in the Properties window or you can also set the property programmatically.

Set the Stacking property to Stacked or Stacked100pc to create the stacking SplineSymbols Chart.

Take an example of a pool campus drive in which three IT organizations participate and hire students for their Canada, Mexico, US, Colombia, and Chile centres. The participating organizations are TCS, Wipro, and Infosys.

Let us visualize the given data by using the SplineSymbols Chart to depict the number of students hired by the companies for their various centres.

Sample Data Table

Centre Hired by TCS Hired by Wipro Hired by Infosys
Canada 450 350 150
Mexico 200 300 550
US 500 350 300
Colombia 350 650 600
Chile 650 550 400

SplineSymbols Chart


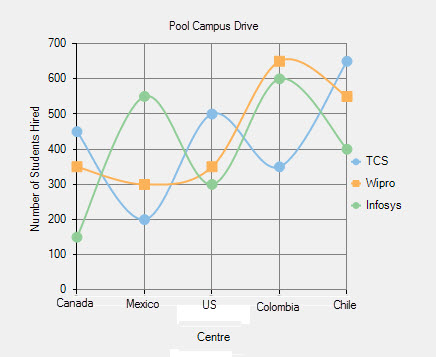
The above chart displays the number of students hired by TCS, Wipro, and Infosys for their five different centres.

See the following code for implementation:

' create a datatable
Dim dt As New DataTable("Pool Campus Drive")

' add columns to the datatable
dt.Columns.Add("Centre", GetType(String))
dt.Columns.Add("Hired by TCS", GetType(Integer))
dt.Columns.Add("Hired by Wipro", GetType(Integer))
dt.Columns.Add("Hired by Infosys", GetType(Integer))

' add rows to the datatable
dt.Rows.Add("Canada", 450, 350, 150)
dt.Rows.Add("Mexico", 200, 300, 550)
dt.Rows.Add("US", 500, 350, 300)
dt.Rows.Add("Colombia", 350, 650, 600)
dt.Rows.Add("Chile", 650, 550, 400)

' clear data series collection
FlexChart1.Series.Clear()

' create data series
Dim series1 As New C1.Win.Chart.Series()
Dim series2 As New C1.Win.Chart.Series()
Dim series3 As New C1.Win.Chart.Series()

' add the data series to the data series collection
FlexChart1.Series.Add(series1)
FlexChart1.Series.Add(series2)
FlexChart1.Series.Add(series3)

' specify the datasource for the chart
FlexChart1.DataSource = dt

' bind the X-axis
FlexChart1.BindingX = "Centre"

' bind the Y axes
series1.Binding = "Hired by TCS"
series2.Binding = "Hired by Wipro"
series3.Binding = "Hired by Infosys"

' name the series
series1.Name = "TCS"
series2.Name = "Wipro"
series3.Name = "Infosys"

' set the chart type to splinesymbols
FlexChart1.ChartType = C1.Chart.ChartType.SplineSymbols
// create a datatable
DataTable dt = new DataTable("Pool Campus Drive");

// add columns to the datatable
dt.Columns.Add("Centre", typeof(string));
dt.Columns.Add("Hired by TCS", typeof(int));
dt.Columns.Add("Hired by Wipro", typeof(int));
dt.Columns.Add("Hired by Infosys", typeof(int));

// add rows to the datatable
dt.Rows.Add("Canada", 450, 350, 150);
dt.Rows.Add("Mexico", 200, 300, 550);
dt.Rows.Add("US", 500, 350, 300);
dt.Rows.Add("Colombia", 350, 650, 600);
dt.Rows.Add("Chile", 650, 550, 400);
            
// clear data series collection
flexChart1.Series.Clear();

// create data series
C1.Win.Chart.Series series1 = new C1.Win.Chart.Series();
C1.Win.Chart.Series series2 = new C1.Win.Chart.Series();
C1.Win.Chart.Series series3 = new C1.Win.Chart.Series();

// add the data series to the data series collection
flexChart1.Series.Add(series1);
flexChart1.Series.Add(series2);
flexChart1.Series.Add(series3);

// specify the datasource for the chart
flexChart1.DataSource = dt;

// bind the X-axis
flexChart1.BindingX = "Centre";

// bind the Y axes
series1.Binding = "Hired by TCS";
series2.Binding = "Hired by Wipro";
series3.Binding = "Hired by Infosys";

// name the series
series1.Name = "TCS";
series2.Name = "Wipro";
series3.Name = "Infosys";
      
// set the chart type to splinesymbols
flexChart1.ChartType = C1.Chart.ChartType.SplineSymbols;