ComponentOne FlexChart for WinForms
Scatter
FlexChart > Understanding FlexChart > FlexChart Types > Scatter

The Scatter Chart, which is also known as the XY Chart, depicts relationship among items of different data series. In simple terms, it is a plot of X values and Y values along the two Axis. The data points are not connected and can be customized using different symbols. This chart type is normally used to represent scientific data, and can highlight the deviation of assembled data from predicted data or result.

To create the Scatter Chart, you can set the ChartType property to Scatter at design-time as well as run-time.

Set the Stacking property to Stacked or Stacked100pc to create the stacking Scatter Chart.

Suppose that there is an ABC Warehouse that deals in garments and accessories. The inventory department and the sales department of the warehouse try discerning the relationship between the profit earned and amount sold at specific sales amounts in 2013, 2014, and 2015. Apparently, they wish to put a specific limit at the quantity of items purchased at the beginning of a year to prevent the unsold items from getting tampered or wasted at the end of the year.

Let us use the Scatter Chart to depict the required relationship.

Sample Data Table

2013

Profit % Sales Amount (Lakhs)
43 10
44 20
50 30
35 40
60 50

2014

Profit % Sales Amount (Lakhs)
50 10
33 20
61 30
45 40
64 50

2015

Profit % Sales Amount (Lakhs)
52 10
40 20
55 30
41 40
67 50

Scatter Chart

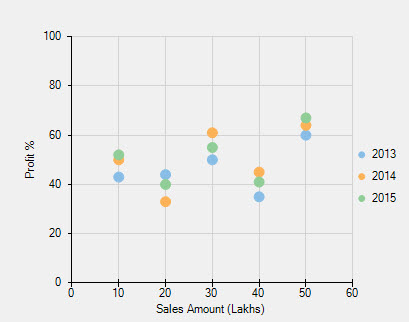
The above chart depicts the relationship between profit % and sales amount in three years.

Below is the code implementing the scenario:

' clear data series collection
FlexChart1.Series.Clear()

' create data series
Dim series1 As New C1.Win.Chart.Series()
Dim series2 As New C1.Win.Chart.Series()
Dim series3 As New C1.Win.Chart.Series()

' add data points into the data series
series1.BindingX = "X"
series1.Binding = "Y"
series1.DataSource = New System.Drawing.Point() {
New System.Drawing.Point(10, 43),
New System.Drawing.Point(20, 44),
New System.Drawing.Point(30, 50),
New System.Drawing.Point(40, 35),
New System.Drawing.Point(50, 60)}
series1.Name = "2013"

series2.BindingX = "X"
series2.Binding = "Y"
series2.DataSource = New System.Drawing.Point() {
New System.Drawing.Point(10, 50),
New System.Drawing.Point(20, 33),
New System.Drawing.Point(30, 61),
New System.Drawing.Point(40, 45),
New System.Drawing.Point(50, 64)}
series2.Name = "2014"

series3.BindingX = "X"
series3.Binding = "Y"
series3.DataSource = New System.Drawing.Point() {
New System.Drawing.Point(10, 52),
New System.Drawing.Point(20, 40),
New System.Drawing.Point(30, 55),
New System.Drawing.Point(40, 41),
New System.Drawing.Point(50, 67)}
series3.Name = "2015"

' add the data series to the data series collection
FlexChart1.Series.Add(series1)
FlexChart1.Series.Add(series2)
FlexChart1.Series.Add(series3)

' set the chart type to scatter
FlexChart1.ChartType = C1.Chart.ChartType.Scatter
// clear data series collection
flexChart1.Series.Clear();

// create data series
C1.Win.Chart.Series series1 = new C1.Win.Chart.Series();
C1.Win.Chart.Series series2 = new C1.Win.Chart.Series();
C1.Win.Chart.Series series3 = new C1.Win.Chart.Series();
            
// add data points into the data series
series1.BindingX = "X";
series1.Binding = "Y";
series1.DataSource = new System.Drawing.Point[] {
new System.Drawing.Point(10,43),
new System.Drawing.Point(20,44),
new System.Drawing.Point(30,50),
new System.Drawing.Point(40,35),
new System.Drawing.Point(50,60)};
series1.Name = "2013";

series2.BindingX = "X";
series2.Binding = "Y";
series2.DataSource = new System.Drawing.Point[] {
new System.Drawing.Point(10,50),
new System.Drawing.Point(20,33),
new System.Drawing.Point(30,61),
new System.Drawing.Point(40,45),
new System.Drawing.Point(50,64)};
series2.Name = "2014";

series3.BindingX = "X";
series3.Binding = "Y";
series3.DataSource = new System.Drawing.Point[] {
new System.Drawing.Point(10,52),
new System.Drawing.Point(20,40),
new System.Drawing.Point(30,55),
new System.Drawing.Point(40,41),
new System.Drawing.Point(50,67)};
series3.Name = "2015";
            
// add the data series to the data series collection
flexChart1.Series.Add(series1);
flexChart1.Series.Add(series2);
flexChart1.Series.Add(series3);
           
// set the chart type to scatter
flexChart1.ChartType = C1.Chart.ChartType.Scatter;