RangedHistogram is a modern Excel-like histogram chart that helps visualize frequency distribution on y axis, against ranged x axis. Like Histogram chart type, bins are created by dividing the raw data values into a series of consecutive, non-overlapping intervals. Based on the number of values falling in a particular bin, frequencies are then plotted as rectangular columns against x-axis.
RangedHistogram plots frequency distribution for the provided data in non-category and category modes.
Non-Category Mode
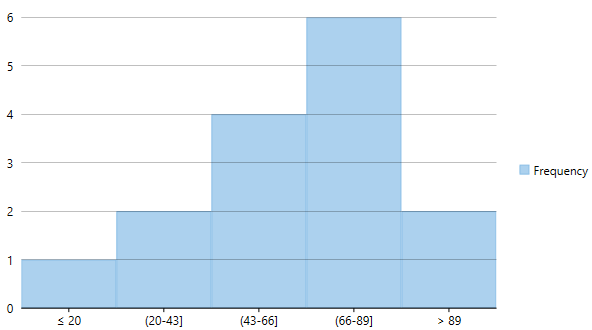
In non-category mode, the original data points are binned into intervals or ranges. These intervals are then plotted on x-axis, and y-axis shows frequency distribution for respective ranges. FlexChart automatically calculates the intervals in which your data is grouped.
However, you can control this behavior by specifying the HistogramBinning through BinMode property. Moreover, you can further set BinWidth, NumberOfBins, values for UnderflowBin and OverflowBin, and specify whether to ShowUnderflowBin and ShowOverflowBin.
The following image illustrates frequency distribution for units sold of various products of a retail store in non-category mode.
To create a RangedHistogram, for a given data in non-category mode, you need to add the RangedHistogram series and set the ChartType property to RangedHistogram, as shown in the following code snippet.
public partial class RHistogram : Form
{

    C1.Win.Chart.RangedHistogram histogramRSeries;
    public RHistogram()
    {
        InitializeComponent();
        SetRangedChart();
    }

    void SetRangedChart()
    {
        flexChart2.Dock = DockStyle.Fill;
        flexChart2.Visible = true;
        flexChart2.BackColor = Color.White;

        flexChart2.BeginUpdate();
        flexChart2.Series.Clear();
        flexChart2.ChartType = ChartType.RangedHistogram;

        histogramRSeries = new C1.Win.Chart.RangedHistogram();
        histogramRSeries.Name = "Frequency";
        flexChart2.Series.Add(histogramRSeries);

        flexChart2.DataSource = new[]
        {
             new { Name = "Stationery", Value = 20 },
                new { Name = "Books", Value = 35 },
                new { Name = "Toys and Games", Value = 40 },
                new { Name = "Stationery", Value = 55 },
                new { Name = "Books", Value = 80 },
                new { Name = "Toys and Games", Value = 60 },
                new { Name = "Stationery", Value = 61 },
                new { Name = "Books", Value = 85 },
                new { Name = "Toys and Games", Value = 80 },
                new { Name = "Stationery", Value = 64 },
                new { Name = "Books", Value = 80 },
                new { Name = "Toys and Games", Value = 75 },
                new { Name = "Stationery", Value = 1222 },
                new { Name = "Books", Value = 133 },
                new { Name = "Toys and Games", Value = 80 },
        };

        flexChart2.Binding = "Value";
        histogramRSeries.BinMode = HistogramBinning.NumberOfBins;
        histogramRSeries.NumberOfBins = 5;
        histogramRSeries.OverflowBin = 89;
        histogramRSeries.UnderflowBin = 20;
        histogramRSeries.ShowOverflowBin = true;
        histogramRSeries.ShowUnderflowBin = true;
        flexChart2.EndUpdate();
    }

}
Category Mode
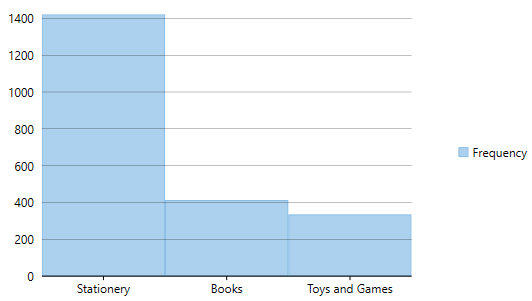
In Category mode, frequency data is exclusively grouped in categories (which are plotted on x-axis) as provided by the original data and y-axis depicts cumulative frequency for the respective categories. Category mode is enabled for RangedHistogram series by setting the BindingX property.
In this mode, BinMode, BinWidth, NumberOfBins, OverflowBin, and UnderflowBin properties for RangedHistogram series are ignored.
The following image illustrates frequency distribution for units sold of 3 categories of products Stationery items, Books, and Toys and Games of a retail store in category mode.
To create a RangedHistogram for a given data in category mode, you need to add the RangedHistogram series, set the ChartType property to RangedHistogram and set the BindingX property, as shown in the following code snippet.
public partial class RHistogram : Form
{

    C1.Win.Chart.RangedHistogram histogramRSeries;
    public RHistogram()
    {
        InitializeComponent();
        SetRangedChart();
    }

    void SetRangedChart()
    {
        flexChart2.Dock = DockStyle.Fill;
        flexChart2.Visible = true;
        flexChart2.BackColor = Color.White;

        flexChart2.BeginUpdate();
        flexChart2.Series.Clear();
        flexChart2.ChartType = ChartType.RangedHistogram;

        histogramRSeries = new C1.Win.Chart.RangedHistogram();
        histogramRSeries.Name = "Frequency";
        flexChart2.Series.Add(histogramRSeries);

        flexChart2.DataSource = new[]
        {
             new { Name = "Stationery", Value = 20 },
                new { Name = "Books", Value = 35 },
                new { Name = "Toys and Games", Value = 40 },
                new { Name = "Stationery", Value = 55 },
                new { Name = "Books", Value = 80 },
                new { Name = "Toys and Games", Value = 60 },
                new { Name = "Stationery", Value = 61 },
                new { Name = "Books", Value = 85 },
                new { Name = "Toys and Games", Value = 80 },
                new { Name = "Stationery", Value = 64 },
                new { Name = "Books", Value = 80 },
                new { Name = "Toys and Games", Value = 75 },
                new { Name = "Stationery", Value = 1222 },
                new { Name = "Books", Value = 133 },
                new { Name = "Toys and Games", Value = 80 },
        };

        flexChart2.Binding = "Value";
        flexChart2.BindingX = "Name";
        histogramRSeries.BinMode = HistogramBinning.NumberOfBins;
        histogramRSeries.NumberOfBins = 5;
        histogramRSeries.OverflowBin = 89;
        histogramRSeries.UnderflowBin = 20;
        histogramRSeries.ShowOverflowBin = true;
        histogramRSeries.ShowUnderflowBin = true;
        flexChart2.EndUpdate();
    }

}
Note that unlike traditional Histogram, other chart types cannot be plotted using the same x axis values as RangedHistogram.