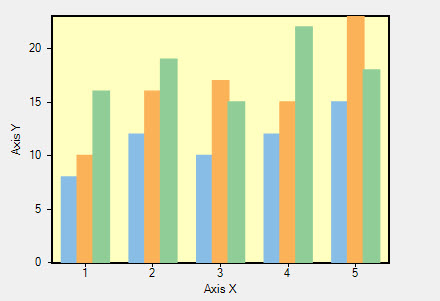
The Plot Area contains data plotted against X-axis and Y-axis.
In FlexChart, the Plot Area can be customized by the following properties of the ChartStyle object:
| Property | Description |
|---|---|
| Fill | Sets the color of the Plot Area. |
| Font | Sets the font of the Plot Area. |
| Stroke | Sets the stroke brush of the Plot Area. |
| StrokeDashPattern | Sets the stroke dash pattern of the Plot Area. |
| StrokeWidth | Sets the stroke width of the Plot Area. |
| LinePattern | Sets the line pattern of the Ploat Area. |
In addition, FlexChart allows creating multiple plot areas that increase data visibility by displaying a single series in a separate plot area.
For more information about multiple plot areas, refer to Multiple Plot Areas.