ComponentOne FlexChart for WinForms
Numerical Axis Grouping
FlexChart > Working with FlexChart > FlexChart Elements > Axis Labels > Axis Grouping > Numerical Axis Grouping

Numerical axis grouping is applicable in scenarios where the data displayed on the axis represents numeric values. To implement numerical axis grouping in FlexChart, set the GroupProvider property to an object of the IAxisGroupProvider implementation.

In the example code below, we have created a class NumericAxisGroupProvider that implements the IAxisGroupProvider interface. The interface provides GetLevels method that returns the group levels and GetRanges method that returns the group ranges for a given level. Moreover, FlexChart allows you to set the group separator using the GroupSeparator property.

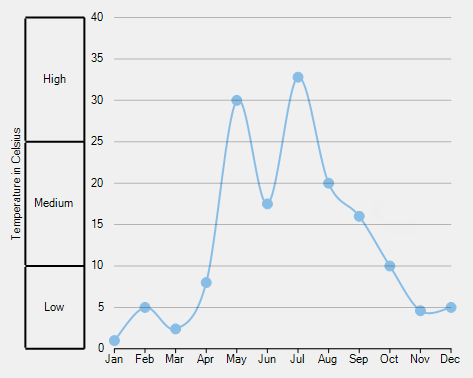
The following image shows how FlexChart appears after setting the numerical axis grouping.

Add the following code in Form1.cs file.

Partial Public Class Form1
    Inherits Form
    Public Sub New()
        InitializeComponent()
        flexChart1.ChartType = ChartType.SplineSymbols
        flexChart1.DataSource = TemperatureRecord.Records()
        flexChart1.BindingX = "Month"
        flexChart1.Binding = "Temperature"
        flexChart1.AxisY.GroupProvider = New NumericAxisGroupProvider()
        flexChart1.AxisY.GroupSeparator = AxisGroupSeparator.Grid
        flexChart1.AxisY.Title = "Temperature in Celsius"
        flexChart1.AxisY.Min = 0
        flexChart1.AxisY.Max = 40
        Dim series = New Series()
        flexChart1.Series.Add(series)
    End Sub

    Class NumericAxisGroupProvider Inherits IAxisGroupProvider
        Public Function GetLevels(ByVal range As IRange) As Integer
            Return 1
        End Function

        Public Function GetRanges(ByVal range As IRange, ByVal level As Integer) As IList(Of IRange)
            Dim ranges = New List(Of IRange)()
            If level = 1 Then
                ranges.Add(New DoubleRange("Low", 0, 10))
                ranges.Add(New DoubleRange("Medium", 10, 25))
                ranges.Add(New DoubleRange("High", 25, 40))
            End If
            Return ranges
        End Function
    End Class
End Class
public partial class Form1 : Form
    {
        public Form1()
        {
            InitializeComponent();
            flexChart1.ChartType = ChartType.SplineSymbols;
            flexChart1.DataSource = TemperatureRecord.Records();
            flexChart1.BindingX = "Month";
            flexChart1.Binding = "Temperature";
            flexChart1.AxisY.GroupProvider = new NumericAxisGroupProvider();
            
            flexChart1.AxisY.GroupStyle.StrokeWidth = 2;
            flexChart1.AxisY.GroupSeparator = AxisGroupSeparator.Grid;
            flexChart1.AxisY.Title = "Temperature in Celsius";
            flexChart1.AxisY.Min = 0;
            flexChart1.AxisY.Max = 40;
            
            flexChart1.Series.Clear();
            var series = new Series();
            flexChart1.Series.Add(series);
        }

        class NumericAxisGroupProvider : IAxisGroupProvider
        {
            public int GetLevels(IRange range)
            {
                return 1;
            }

            public IList<IRange> GetRanges(IRange range, int level)
            {
                var ranges = new List<IRange>();
                if (level == 1)
                {
                    ranges.Add(new DoubleRange("Low", 0, 10));
                    ranges.Add(new DoubleRange("Medium", 10, 25));
                    ranges.Add(new DoubleRange("High", 25, 40));
                }
                return ranges;
            }
        }