ComponentOne FlexChart for WinForms
Line Marker
FlexChart > Working with FlexChart > End-User Interaction > Line Marker

LineMarker displays the precise data values for a given position on the chart by dragging horizontal or vertical lines over the plot with an attached label. It is useful in scenarios, where a user has a lot of data in a line or area chart, or if a user wants to display data from multiple series in a single label. With built-in interactions, such as Drag and Move, a user can drag the line marker and more precisely select the data point on the chart.

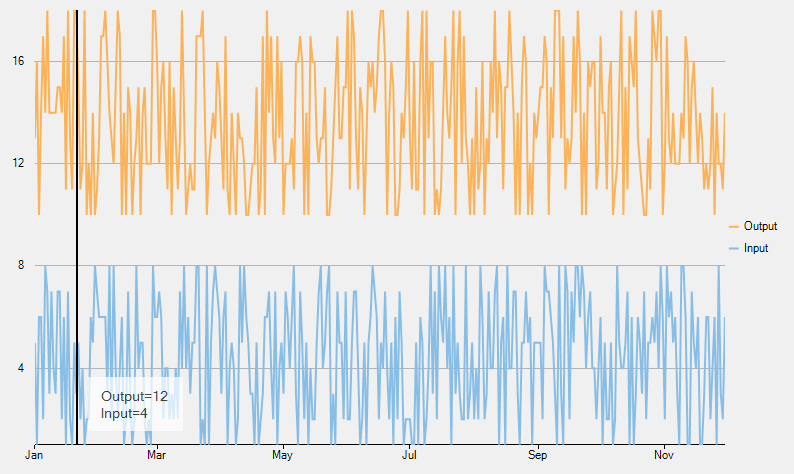
The following image shows LineMarker displaying data values for a specific position on the chart.

To create a line marker and use it in FlexChart, create an instance of the C1.Win.Chart.Interaction.LineMarker class. While creating the instance, pass a parameter that is an object of the C1.Win.Chart.FlexChart type. Use the Lines property provided by LineMarker to set the visibility of the LineMarker lines. The Lines property accepts the following values from the LineMarkerLines enumeration:

The LineMarker class also provides the Alignment property to set the alignment of the line marker. In addition, set the interaction mode of the line marker by setting the Interaction property to any of the following values in the LineMarkerInteraction enumeration:

If you set the Interaction property to Drag, you need to set the DragContent and the DragLines property to specify whether the content and values linked with the line marker lines are draggable or not. In addition, the LineMarker class provides the Content property that you can use to customize the text content of the line marker. Furthermore, you can set the initial position of the line marker relative to the plot area with the help of VerticalPosition and HorizontalPostion properties. The acceptable range for these properties is [0,1].

The following code snippet implements the aforementioned classes and properties.

Imports System.Windows.Forms
Imports C1.Win.Chart.Interaction
Imports System.Drawing
Imports C1.Win.Chart
Imports System.Collections.Generic

Partial Public Class Form1
    Inherits Form
    Private lineMarker As C1.Win.Chart.Interaction.LineMarker

    Public Sub New()
        InitializeComponent()
        SetupChart()
    End Sub

    Private Sub SetupChart()

        Dim rnd = New Random()
        Dim pointsCount = rnd.[Next](1, 30)

        Dim pointsList = New List(Of DataItem)()
        Dim [date] As New DateTime(DateTime.Now.Year - 1, 1, 1)
        While [date].Month < DateTime.Now.Month + 2
            pointsList.Add(New DataItem() With {
                .[Date] = [date],
                .Input = rnd.[Next](1, 9),
                .Output = rnd.[Next](10, 19)
            })
            [date] = [date].AddDays(1)
        End While

        FlexChart1.BeginUpdate()
        FlexChart1.Series.Clear()
        FlexChart1.ChartType = C1.Chart.ChartType.Line

        FlexChart1.BindingX = "Date"

        Dim outputSerie = New C1.Win.Chart.Series() With {
            .Name = "Output",
            .Binding = "Output"
        }
        outputSerie.Style.StrokeColor = Color.FromArgb(255, 251, 178, 88)
        FlexChart1.Series.Add(outputSerie)

        Dim inputSerie = New C1.Win.Chart.Series() With {
            .Name = "Input",
            .Binding = "Input"
        }
        inputSerie.Style.StrokeColor = Color.FromArgb(255, 136, 189, 230)
        FlexChart1.Series.Add(inputSerie)

        FlexChart1.DataSource = pointsList.ToArray()

        FlexChart1.EndUpdate()

        AddHandler FlexChart1.Rendered, AddressOf flexChart1_Rendered
    End Sub

    Private Sub flexChart1_Rendered(sender As Object, e As RenderEventArgs)
        If lineMarker Is Nothing Then
            Dim lineMarker As New C1.Win.Chart.Interaction.LineMarker(FlexChart1)
            lineMarker.LineWidth = 2
            lineMarker.DragThreshold = 10
            lineMarker.Content = "Output={Output}" & vbLf & "Input={Input}"
            lineMarker.Alignment = LineMarkerAlignment.Auto
            lineMarker.Interaction = LineMarkerInteraction.Move
            lineMarker.Lines = LineMarkerLines.Vertical
        End If
    End Sub

    Private Class DataItem
        Public Property Input() As Integer
            Get
                Return m_Input
            End Get
            Set
                m_Input = Value
            End Set
        End Property
        Private m_Input As Integer
        Public Property Output() As Integer
            Get
                Return m_Output
            End Get
            Set
                m_Output = Value
            End Set
        End Property
        Private m_Output As Integer
        Public Property [Date]() As DateTime
            Get
                Return m_Date
            End Get
            Set
                m_Date = Value
            End Set
        End Property
        Private m_Date As DateTime
    End Class
End Class
using System;
using System.Windows.Forms;
using C1.Win.Chart.Interaction;
using System.Drawing;
using C1.Win.Chart;
using System.Collections.Generic;

namespace LineMarker
{
    public partial class Form1 : Form
    {
        C1.Win.Chart.Interaction.LineMarker lineMarker;

        public Form1()
        {
            InitializeComponent();
            SetupChart();
        }

        void SetupChart()
        {

            var rnd = new Random();
            var pointsCount = rnd.Next(1, 30);

            var pointsList = new List<DataItem>();
            for (DateTime date = new DateTime(DateTime.Now.Year - 1, 1, 1); 
                date.Month < DateTime.Now.Month + 2; date = date.AddDays(1))
            {
                pointsList.Add(new DataItem()
                {
                    Date = date,
                    Input = rnd.Next(1, 9),
                    Output = rnd.Next(10, 19)
                });
            }

            flexChart1.BeginUpdate();
            flexChart1.Series.Clear();
            flexChart1.ChartType = C1.Chart.ChartType.Line;

            flexChart1.BindingX = "Date";

            var outputSerie = new C1.Win.Chart.Series() { Name = "Output", Binding = "Output" };
            outputSerie.Style.StrokeColor = Color.FromArgb(255, 251, 178, 88);
            flexChart1.Series.Add(outputSerie);

            var inputSerie = new C1.Win.Chart.Series() { Name = "Input", Binding = "Input" };
            inputSerie.Style.StrokeColor = Color.FromArgb(255, 136, 189, 230);
            flexChart1.Series.Add(inputSerie);

            flexChart1.DataSource = pointsList.ToArray();

            flexChart1.EndUpdate();

            flexChart1.Rendered += flexChart1_Rendered;
        }

        void flexChart1_Rendered(object sender, RenderEventArgs e)
        {
            if (lineMarker == null)
            {
                C1.Win.Chart.Interaction.LineMarker lineMarker = new C1.Win.Chart.Interaction.LineMarker(flexChart1);
                lineMarker.LineWidth = 2;
                lineMarker.DragThreshold = 10;
                lineMarker.Content = "Output={Output}\nInput={Input}";
                lineMarker.Alignment = LineMarkerAlignment.Auto;
                lineMarker.Interaction = LineMarkerInteraction.Move;
                lineMarker.Lines = LineMarkerLines.Vertical;
            }
        }

        class DataItem
        {
            public int Input { get; set; }
            public int Output { get; set; }
            public DateTime Date { get; set; }
        }

    }
}