FlexChart supports hit testing, which enables you to fetch information about a specific point in the control at run-time. The information obtained about the pointed coordinate can then be reused to drill down the chart data, to set alerts, or to enable other user interaction functionalities.
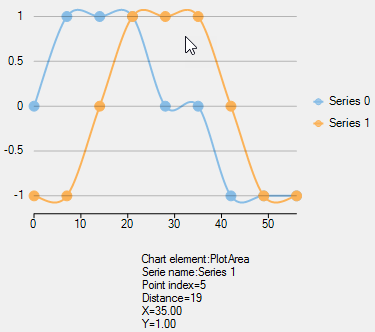
FlexChart supports hit testing by utilizing HitTest() method. This method takes two overloads, one accepts pointer location and the other accepts pointer location, MeasureOption, and seriesIndex value in the control as parameters; and returns an object of HitTestInfo class, which provides the following information about the pointer location:
- Chart element comprising the pointer
- Distance of the pointer location from the closest data point in chart, if the pointer is within plot area. Distance is returned as Double.Nan, if the pointer is outside the plot area.
This distance value varies depending upon the MeasureOption being used. For example, with MeasureOption.X, the Distance is calculated along the X-axis only. - Data object corresponding to the closest data point
- Index of the nearest data point
- Series name that the nearest data point belongs to
- X value of the nearest data point
- Y value of the nearest data point
In this example, HitTest() method is called on MouseMove event of the FlexChart control. Here, the point coordinates of pointer location are passed as parameter to HitTest() method.
To enable hit testing in FlexChart, follow these steps:
- Add a data bound FlexChart control
- Subscribe to a Mouse event
- Invoke chart’s HitTest method in mouse event handler
- Use the information returned by HitTestInfo object
-
Add a data bound FlexChart control
Add an instance of FlexChart control to your application, and bind it to an appropriate data source, as shown in the below code snippet.
-
Subscribe to a Mouse event
Subscribe to a mouse event to capture the pointer coordinates, as shown in the below code snippet.
-
Invoke chart’s HitTest method in mouse event handler
In the respective event handler, invoke the HitTest() method and pass the captured mouse pointer coordinates, as shown in the below code snippet.
-
Use the information returned by HitTestInfo object
The information regarding mouse pointer location, as returned by the HitTestInfo object, can then be reused. For example in the below code snippet, the values returned by HitTestInfo object are converted to string and displayed in a TextBlock.