ComponentOne FlexChart for WinForms
HighLowOpenClose
FlexChart > Understanding FlexChart > FlexChart Types > Financial > HighLowOpenClose

The HighLowOpenClose Chart is generally used in stock analysis. The chart combines four independent values to supply high, low, open, and close data values for each data point in a series.

Consider a stock market scenario in which a stock is to be analyzed in terms of its price for one week. The analysis needs to depict the stock price summary, so that the growth/decline can easily be interpreted.

The HighLowOpenClose Chart can be used in this case.

Sample Data Table

Day High Low Open Close
Mon 450 190 350 380
Tue 470 200 300 390
Wed 420 160 290 350
Thu 440 220 330 400
Fri 500 210 350 470
Sat 390 250 310 360

HighLowOpenClose Chart


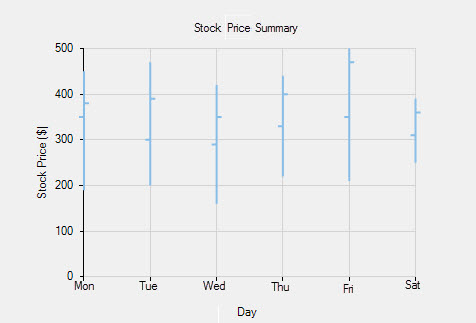
The above chart displays the stock summary for a particular week.

See the following code for implementing the scenario:

' create a datatable
Dim dt As New DataTable("Stock Value Summary")

' add columns to the datatable
dt.Columns.Add("Day", GetType(String))
dt.Columns.Add("High", GetType(Integer))
dt.Columns.Add("Low", GetType(Integer))
dt.Columns.Add("Open", GetType(Integer))
dt.Columns.Add("Close", GetType(Integer))

' add rows to the datatable
dt.Rows.Add("Mon", 450, 190, 350, 380)
dt.Rows.Add("Tue", 470, 200, 300, 390)
dt.Rows.Add("Wed", 420, 160, 290, 350)
dt.Rows.Add("Thu", 440, 220, 330, 400)
dt.Rows.Add("Fri", 500, 210, 350, 470)
dt.Rows.Add("Sat", 390, 250, 310, 360)

' clear data series collection
FlexChart1.Series.Clear()

' create data series              
Dim series1 As New C1.Win.Chart.Series()

' add the data series to the data series collection
FlexChart1.Series.Add(series1)

' specify the datasource for the chart
FlexChart1.DataSource = dt

' bind X-axis and Y-axis
FlexChart1.BindingX = "Day"
series1.Binding = "High,Low,Open,Close"

' set the chart type to candlestick
FlexChart1.ChartType = C1.Chart.ChartType.HighLowOpenClose
// create a datatable
DataTable dt = new DataTable("Stock Value Summary");

// add columns to the datatable
dt.Columns.Add("Day", typeof(string));
dt.Columns.Add("High", typeof(int));
dt.Columns.Add("Low", typeof(int));
dt.Columns.Add("Open", typeof(int));
dt.Columns.Add("Close", typeof(int));

// add rows to the datatable
dt.Rows.Add("Mon", 450, 190, 350, 380);
dt.Rows.Add("Tue", 470, 200, 300, 390);
dt.Rows.Add("Wed", 420, 160, 290, 350);
dt.Rows.Add("Thu", 440, 220, 330, 400);
dt.Rows.Add("Fri", 500, 210, 350, 470);
dt.Rows.Add("Sat", 390, 250, 310, 360);

// clear data series collection
flexChart1.Series.Clear();

// create data series              
C1.Win.Chart.Series series1 = new C1.Win.Chart.Series();

// add the data series to the data series coltion
flexChart1.Series.Add(series1);

// specify the datasource for the chart
flexChart1.DataSource = dt;

// bind X-axis and Y-axis
flexChart1.BindingX = "Day";
series1.Binding = "High,Low,Open,Close";

// set the chart type to candlestick
flexChart1.ChartType = C1.Chart.ChartType.HighLowOpenClose;