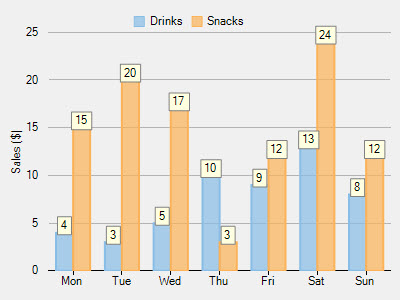
FlexChart provides a number of options to format data labels the way you want. You can set and style borders of data labels, connect them with their corresponding data points, and customize the way data labels appear.
Setting and Styling Borders of Data Labels
Borders add an extra appeal to data labels and make them more highlighted. This comes in handy to seamlessly highlight really crucial data in the chart, so that end users can focus on what is important.
In FlexChart, borders can be enabled and customized by using different properties, such as Border and BorderStyle.
Here is the code snippet illustrating the setting and the customization of borders.

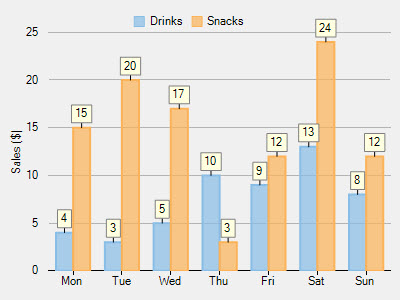
Connecting Data Labels to Data Points
If you have placed data labels away from their corresponding data points, you can connect them using leader lines. A leader line is a line that connects a data label to its data point. Leader lines are beneficial to use, especially when you need to display a visual connection between data labels and their associated data points.
FlexChart does not display leader lines by default when you add data labels; nevertheless, you can enable leader lines and even set their appropriate length to create better visual connections for data labels in the chart. To enable leader lines, you need to use the ConnectingLine property. And to set the distance between data labels and their data points, you need to use the Offset property.
The following code snippet sets both the properties.

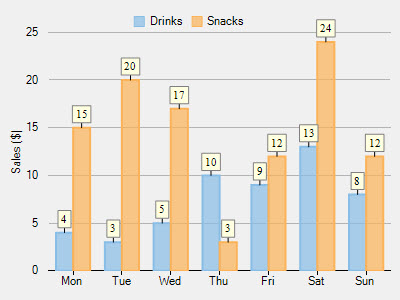
Changing the Appearance of Data Labels
You can make data visualization powerful and appealing by changing the way data labels appear in the chart. FlexChart contains various styling options, which you can use to enhance the clarity and look of data labels. You can use the Style property to change the appearance of data labels.
See the following code snippet for reference.
