ComponentOne FlexChart for WinForms
Error Bar
FlexChart > Understanding FlexChart > FlexChart Types > Error Bar

Error Bar allows you to indicate variability of data or uncertainty in values. It enables you to display standard deviations and a range of error in variable data using error bars. Generally, results of scientific studies or experimental sciences use error bars in charts to depict variations in data from original values.

FlexChart lets you use Error Bar series in different chart types including Area, Column, Line, LineSymbols, Scatter, Spline, SplineArea, and SplineSymbols.

Error Bar in FlexChart offers several features, as follows:

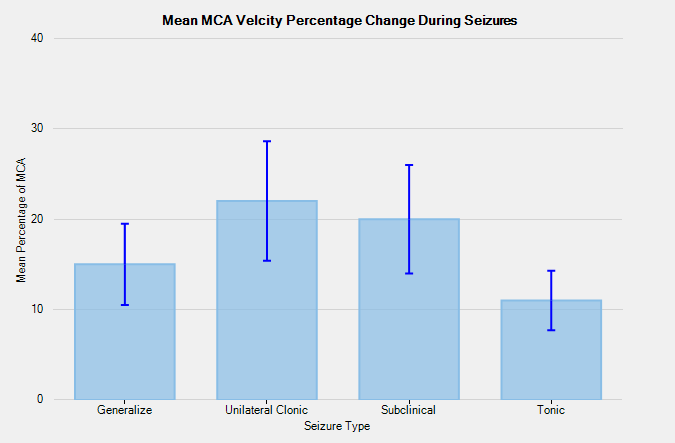
The following image displays Plus and Minus error amounts in the mean MCA (Middle Cerebral Artery) velocity data for different seizure types observed in children. 

The following code uses mean percentage values of MCA velocity during different kinds of seizures in children. The codes shows how to implement ErrorBar series in FlexChart.

' create a datatable
Dim dt As New DataTable()

' add columns to the datatable
dt.Columns.Add("Seizure Type", GetType(String))
dt.Columns.Add("Mean MCA", GetType(Integer))

' add rows to the datatable
dt.Rows.Add("Generalize", 15)
dt.Rows.Add("Unilateral Clonic", 22)
dt.Rows.Add("Subclinical", 20)
dt.Rows.Add("Tonic", 11)

' clear data series collection
flexChart1.Series.Clear()

' create ErrorBar series
Dim errorBar As New C1.Win.Chart.ErrorBar()

' add the series to the data series collection
flexChart1.Series.Add(errorBar)

' specify the datasource for the chart
flexChart1.DataSource = dt

' bind X-axis and Y-axis
flexChart1.BindingX = "Seizure Type"
errorBar.Binding = "Mean MCA"

' specify error amount of the series
errorBar.ErrorAmount = C1.Chart.ErrorAmount.Percentage

' specify the direction of the error
errorBar.Direction = C1.Chart.ErrorBarDirection.Both

' specify the error value of the series
errorBar.ErrorValue = 0.3

' style the ErrorBar series
errorBar.EndStyle = C1.Chart.ErrorBarEndStyle.Cap
errorBar.ErrorBarStyle.StrokeWidth = 2
errorBar.ErrorBarStyle.StrokeColor = Color.Blue
// create a datatable
DataTable dt = new DataTable();

// add columns to the datatable
dt.Columns.Add("Seizure Type", typeof(string));
dt.Columns.Add("Mean MCA", typeof(int));

// add rows to the datatable
dt.Rows.Add("Generalize", 15);
dt.Rows.Add("Unilateral Clonic", 22);
dt.Rows.Add("Subclinical", 20);
dt.Rows.Add("Tonic", 11);

// clear data series collection
flexChart1.Series.Clear();

// create ErrorBar series
C1.Win.Chart.ErrorBar errorBar = new C1.Win.Chart.ErrorBar();
          
// add the series to the data series collection
flexChart1.Series.Add(errorBar);
       
// specify the datasource for the chart
flexChart1.DataSource = dt;

// bind X-axis and Y-axis
flexChart1.BindingX = "Seizure Type";
errorBar.Binding = "Mean MCA";

// specify error amount of the series
errorBar.ErrorAmount = C1.Chart.ErrorAmount.Percentage;

// specify the direction of the error
errorBar.Direction = C1.Chart.ErrorBarDirection.Both;

// specify the error value of the series
errorBar.ErrorValue = .3;

// style the ErrorBar series
errorBar.EndStyle = C1.Chart.ErrorBarEndStyle.Cap;
errorBar.ErrorBarStyle.StrokeWidth = 2;
errorBar.ErrorBarStyle.StrokeColor = Color.Blue;