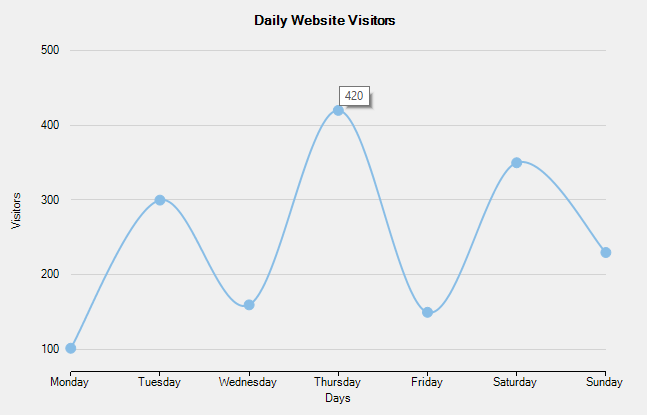
FlexChart displays a default tooltip when you hover over a data point or series. The default tooltip shows the Y value of the hovered data point. FlexChart generates the default tooltip using the underlying data when custom content is not present.
The following image displays the default tooltip showing the data value of a data point.
