ComponentOne FlexChart for WinForms
Candle
FlexChart > Understanding FlexChart > FlexChart Types > Financial > Candle

The Candle Chart integrates Bar and Line charts to depict a range of values over time. It consists of visual elements known as candles that are further comprised of three elements: body, wick, and tail.

Consider a stock market scenario in which a stock is analyzed for five consecutive days in a particular week. The analysis is done to predict the prospective value of the stock. On the basis of the analysis, the general nature of the stock can be implied as well.

The Candle Chart is appropriate to represent the stock value summary.

Sample Data Table

Stock Day Stock Open Stock High Stock Low Stock Close
Monday 37 47 22 28
Tuesday 52 63 30 38
Wednesday 75 77 50 55
Thursday 65 77 50 76
Friday 26 67 22 55

Candle Chart


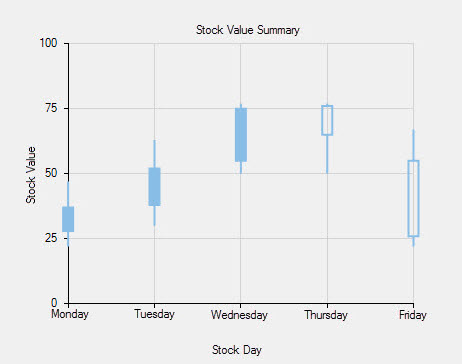
The above chart depicts the stock value summary for five consecutive days in a specific week.

The following code shows the implementation:

' create a datatable
Dim dt As New DataTable("Stock Value Summary")

' add columns to the datatable
dt.Columns.Add("Stock Day", GetType(String))
dt.Columns.Add("Stock Open", GetType(Integer))
dt.Columns.Add("Stock High", GetType(Integer))
dt.Columns.Add("Stock Low", GetType(Integer))
dt.Columns.Add("Stock Close", GetType(Integer))

' add rows to the datatable
dt.Rows.Add("Monday", 37, 47, 22, 28)
dt.Rows.Add("Tuesday", 52, 63, 30, 38)
dt.Rows.Add("Wednesday", 75, 77, 50, 55)
dt.Rows.Add("Thursday", 65, 77, 50, 76)
dt.Rows.Add("Friday", 26, 67, 22, 55)

' clear data series collection
flexChart1.Series.Clear()

' create data series              
Dim series1 As New C1.Win.Chart.Series()

' add the data series to the data series collection
flexChart1.Series.Add(series1)

' specify the datasource for the chart
flexChart1.DataSource = dt

' bind X-axis and Y-axis
FlexChart1.BindingX = "Stock Day"
series1.Binding = "Stock High,Stock Low,Stock Open,Stock Close"

' set the chart type to candlestick
flexChart1.ChartType = C1.Chart.ChartType.Candlestick
// create a datatable
DataTable dt = new DataTable("Stock Value Summary");

// add columns to the datatable
dt.Columns.Add("Stock Day", typeof(string));
dt.Columns.Add("Stock Open", typeof(int));
dt.Columns.Add("Stock High", typeof(int));
dt.Columns.Add("Stock Low", typeof(int));
dt.Columns.Add("Stock Close", typeof(int));

// add rows to the datatable
dt.Rows.Add("Monday", 37, 47, 22, 28);
dt.Rows.Add("Tuesday", 52, 63, 30, 38);
dt.Rows.Add("Wednesday", 75, 77, 50, 55);
dt.Rows.Add("Thursday", 65, 77, 50, 76);
dt.Rows.Add("Friday", 26, 67, 22, 55);
           
// clear data series collection
flexChart1.Series.Clear();

// create data series              
C1.Win.Chart.Series series1 = new C1.Win.Chart.Series();

// add the data series to the data series collection
flexChart1.Series.Add(series1);

// specify the datasource for the chart
flexChart1.DataSource = dt;

// bind X-axis and Y-axis
flexChart1.BindingX = "Stock Day";
series1.Binding = "Stock High,Stock Low,Stock Open,Stock Close";

// set the chart type to candlestick
flexChart1.ChartType = C1.Chart.ChartType.Candlestick;