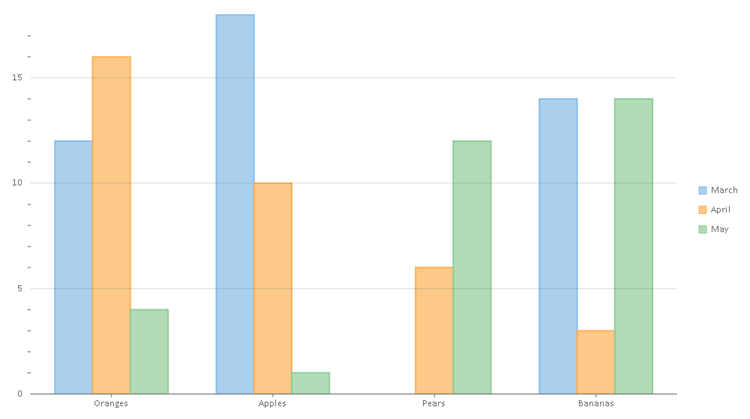
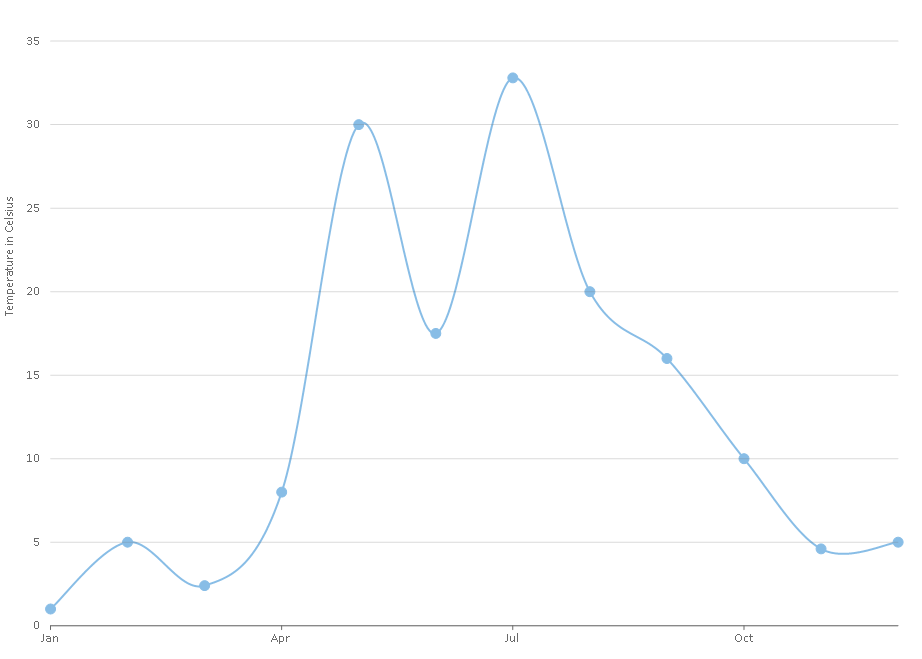
Axis units define at what intervals the tick marks or gridlines should be displayed along the axis. FlexChart, by default, calculates the major and minor units automatically according to the data to be plotted on the chart. However, you can choose to change these intervals by using MajorUnit and MinorUnit property. This change impacts the values displayed on the value axis as well as the positioning of tick marks and grid lines if you choose to show them.
For example, in the FlexChart shown below, we have set the MajorUnit property to 5 and MinorUnit property to 1 on the Y-axis. You will notice that the difference between each major tick mark is 5 and minor tick mark is 1.

Use the following code to set the MajorUnit and MinorUnit properties.
DateTime Axis Units
In case of DateTime axis, FlexChart provides you an option to set the time unit as well using the TimeUnit property. You can choose from day, month, quarter, week, and year options. This property accepts value from the TimeUnits enumeration. The enumeration includes the following values.
- Day
- Week
- Month
- Quarter
- Year
For example, in order to set major unit of a value axis to 3 months, you first need to set the TimeUnit property to Month, and then set the MajorUnit property to 3.
Use the following code to set the TimeUnit and MajorUnit properties.