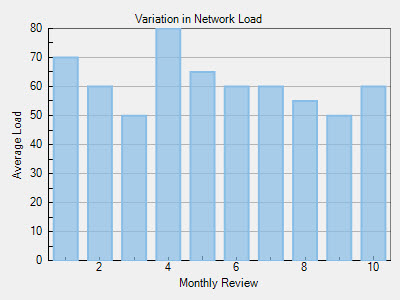
Axis tick marks are the points at which labels are plotted on the axis. In other words, they are the small marks that identify the position of items on the axis. In addition, they divide Axis into equal sections by a value determined by specific properties of an axis. And their location controls the location of grid lines.
When it comes to Axis tick marks, a chart is rendered with two types basically: major tick marks and minor tick marks. Major tick marks are rendered automatically when an axis intersects the interval grid lines. And minor tick marks are rendered between major tick marks.
By default, FlexChart sets up X-axis with major tick marks and Y-axis with no tick marks.
You can, however, use the MajorTickMarks and the MinorTickMarks property to manipulate the position of the major tick marks and the minor tick marks respectively.
Both the properties can be set to any of the following TickMark enumeration values:
| Values | Description |
|---|---|
| TickMark.Cross | Tick marks cross the axis. |
| TickMark.Inside | Tick marks appear inside the plot. |
| TickMark.None | Tick marks don't appear. |
| TickMark.Outside | Tick marks appear outside the plot. |
See the following code sample:
