ComponentOne FlexChart for WinForms
Axis Bounds
FlexChart > Working with FlexChart > FlexChart Elements > Axis > Axis Bounds

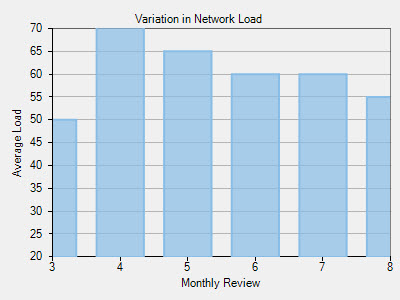
If you want to display a specific portion of the chart in terms of data, you can do so by fixing the axis bounds. With Axis bounds, the chart determines the extent of each axis by reckoning the lowest and the highest data values.

FlexChart enables you to set axis bounds by setting the Min and the Max property for the axis.

The following code shows how to set the Min and the Max property:

' set Min and Max values for X-axis
FlexChart1.AxisX.Min = 3
FlexChart1.AxisX.Max = 8

' set Min and Max values for Y-axis
FlexChart1.AxisY.Min = 20
FlexChart1.AxisY.Max = 70
// set Min and Max values for X-axis
flexChart1.AxisX.Min = 3;
flexChart1.AxisX.Max = 8;

// set Min and Max values for Y-axis
flexChart1.AxisY.Min = 20;
flexChart1.AxisY.Max = 70;