ComponentOne FlexChart for WinForms
Area
FlexChart > Understanding FlexChart > FlexChart Types > Area

The Area Chart depicts change in data over a period of time. It represents data series by connecting data points against Y-axis and filling the area between the series and X-axis. In addition, the chart displays data series in the same order in which they are added—back-to-front.

FlexChart allows you to create the Area Chart both at design-time and run-time. At design-time, you need to set the ChartType property to Area in the Properties window; at run-time, you need to set the same property in code.

You can set the Stacking property to Stacked or Stacked100pc to create the stacking Area Chart.

Suppose there are three stocks, namely AAPL, CIEN, and INTC that have stayed atop from 2013 to 2015 consecutively in the stock market. At the end of 2015, an analysis is done to identify the rise or decline in these stocks (based on their stock values) in the current year over the previous year. The analysis is based upon the values of the respective stocks in 2013, 2014, and 2015.  

Since stock values represent data that varies over a period of time, the Area Chart is apt for this scenario.

Sample Data Table

Stock Name 2013 2014 2015
AAPL 95 109 120
CIEN 89 104 115
INTC 75 95 110

Area Chart


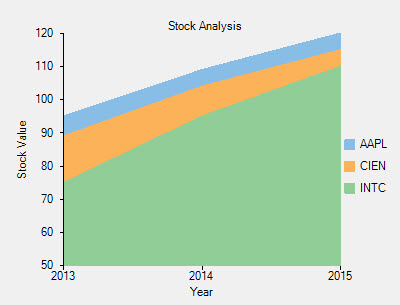
The above chart represents the rise of a stock by plotting the stock values in three consecutive years. The three areas for three different stocks have been rendered using three different colors.

The following code implements the above-mentioned scenario:

' clear data series collection
FlexChart1.Series.Clear()

' create data series
Dim series1 As New C1.Win.Chart.Series()
Dim series2 As New C1.Win.Chart.Series()
Dim series3 As New C1.Win.Chart.Series()

' add data points into the data series
series1.BindingX = "X"
series1.Binding = "Y"
series1.DataSource = New System.Drawing.Point() {
New System.Drawing.Point(2013, 95),
New System.Drawing.Point(2014, 109),
New System.Drawing.Point(2015, 120)}
series1.Name = "AAPL"

series2.BindingX = "X"
series2.Binding = "Y"
series2.DataSource = New System.Drawing.Point() {
New System.Drawing.Point(2013, 89),
New System.Drawing.Point(2014, 104),
New System.Drawing.Point(2015, 115)}
series2.Name = "CIEN"

series3.BindingX = "X"
series3.Binding = "Y"
series3.DataSource = New System.Drawing.Point() {
New System.Drawing.Point(2013, 75),
New System.Drawing.Point(2014, 95),
New System.Drawing.Point(2015, 110)}
series3.Name = "INTC"

' add the data series to the data series collection
FlexChart1.Series.Add(series1)
FlexChart1.Series.Add(series2)
FlexChart1.Series.Add(series3)

' set the chart type to area
FlexChart1.ChartType = C1.Chart.ChartType.Area
// clear data series collection
flexChart1.Series.Clear();

// create data series
C1.Win.Chart.Series series1 = new C1.Win.Chart.Series();
C1.Win.Chart.Series series2 = new C1.Win.Chart.Series();
C1.Win.Chart.Series series3 = new C1.Win.Chart.Series();

// add data points into the data series
series1.BindingX = "X";
series1.Binding = "Y";
series1.DataSource = new System.Drawing.Point[] { 
new System.Drawing.Point(2013,95),
new System.Drawing.Point(2014,109),
new System.Drawing.Point(2015,120) };
series1.Name = "AAPL";

series2.BindingX = "X";
series2.Binding = "Y";
series2.DataSource = new System.Drawing.Point[] { 
new System.Drawing.Point(2013,89),
new System.Drawing.Point(2014,104),
new System.Drawing.Point(2015,115) };
series2.Name = "CIEN";

series3.BindingX = "X";
series3.Binding = "Y";
series3.DataSource = new System.Drawing.Point[] { 
new System.Drawing.Point(2013,75),
new System.Drawing.Point(2014,95),
new System.Drawing.Point(2015,110) };
series3.Name = "INTC";

// add the data series to the data series collection
flexChart1.Series.Add(series1);
flexChart1.Series.Add(series2);
flexChart1.Series.Add(series3);

// set the chart type to area
flexChart1.ChartType = C1.Chart.ChartType.Area;