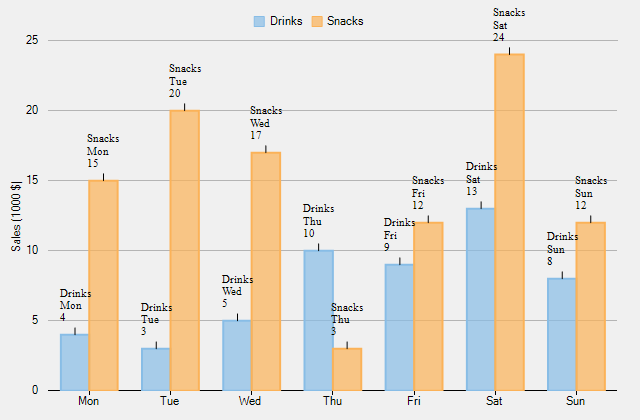
When added to data points in the chart, data labels make it easier to understand the chart data because they display details about individual data points. These labels quickly highlight data that is both relevant and important.
There is a simple method to add data labels to data points while working with FlexChart. You just need to configure the Content property as per the type of entry you want to display in data labels. And you need to set the position of data labels using the Position property to display the data labels in the chart.
The table below lists the pre-defined parameters applicable for data label content customization.
| Parameter | Description |
|---|---|
| x | Shows the X value of the data point. |
| y | Shows the Y value of the data point. |
| value | Shows the Y value of the data point. |
| name | Shows the X value of the data point. |
| seriesName | Shows the name of the series. |
| pointIndex | Shows the index of the data point. |
| P | Shows the percentage share with respect to the parent slice in Sunburst. |
| p | Shows the percentage share with respect to the whole chart in Sunburst. |
See the following code snippet for reference.
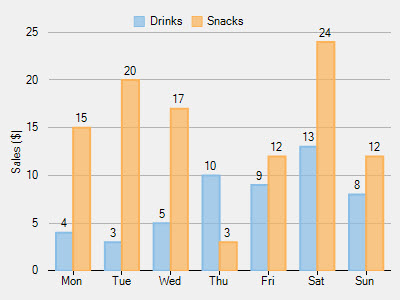
Depending upon the chart type, you can select from different positioning options to position data labels perfectly in the chart. The Position property accepts the following values from the LabelPosition enumeration:
| Property | Description |
|---|---|
| Auto | Sets the label position automatically. |
| Top | Sets the labels above the data points. |
| Bottom | Sets the labels below the data points. |
| Left | Sets the labels to the left of the data points. |
| Right | Sets the labels to the right of the data points. |
| Center | Sets the labels centered on the data points. |
| None | Hides the labels. |
Using the Content property, you can customize the content of the data labels to further include series names, index values, or names of data points.
The following code shows how to set the Content property to include series names and data point values in data labels.