ComponentOne FlexChart for WPF
SplineSymbols
FlexChart > Understanding FlexChart > FlexChart Types > SplineSymbols

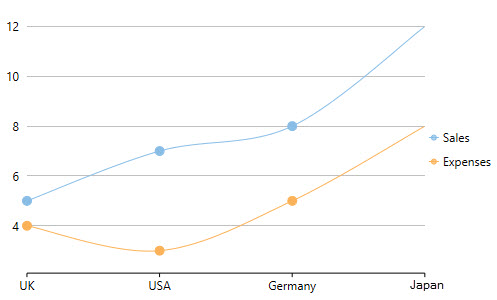
The SplineSymbols Chart combines the Spline Chart and the Scatter Chart. The chart plots data points by using symbols and connects those data points by using splines.

To create the SplineSymbols Chart, you can set the ChartType property to SplineSymbols in the Properties window, in XAML, or programmatically.

Set the Stacking property to Stacked or Stacked100pc to create the stacking SplineSymbols Chart.

SplineSymbols Chart


See the following code for implementation:

<c1:C1FlexChart x:Name="flexChart" 
                BindingX="Country" 
                ItemsSource="{Binding DataContext.Data}" 
                ChartType="SplineSymbols">
    <c1:C1FlexChart.Series>
        <c1:Series SeriesName="Sales" 
                   Binding="Sales"/>
        <c1:Series SeriesName="Expenses" 
                   Binding="Expenses"/>
    </c1:C1FlexChart.Series>
</c1:C1FlexChart>
C#
Copy Code
flexChart.ChartType = C1.Chart.ChartType.SplineSymbols;