ComponentOne FlexChart for WPF
SplineArea
FlexChart > Understanding FlexChart > FlexChart Types > SplineArea

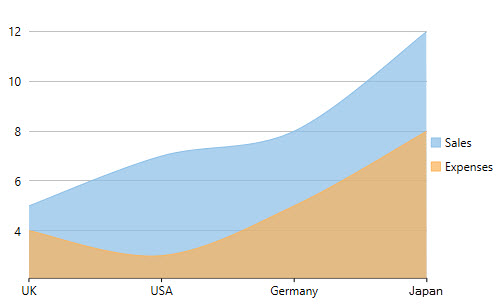
The SplineArea chart is just like the area chart with the only difference in the manner in which data points are connected.  The SplineArea chart connects data points by using splines instead of straight lines, and fills the area enclosed by the splines.

Set the ChartType property to SplineArea in the Properties window, in the code behind, or in XAML to create the SplineArea Chart.

To create the stacking SplineArea Chart, set the Stacking property to Stacked or Stacked100pc.

SplineArea Chart


Here is the implementation in code:

<c1:C1FlexChart x:Name="flexChart" 
                BindingX="Country" 
                ItemsSource="{Binding DataContext.Data}" 
                ChartType="SplineArea">
    <c1:C1FlexChart.Series>
        <c1:Series SeriesName="Sales" 
                   Binding="Sales"/>
        <c1:Series SeriesName="Expenses" 
                   Binding="Expenses"/>
    </c1:C1FlexChart.Series>
</c1:C1FlexChart>
C#
Copy Code
flexChart.ChartType = C1.Chart.ChartType.SplineArea;