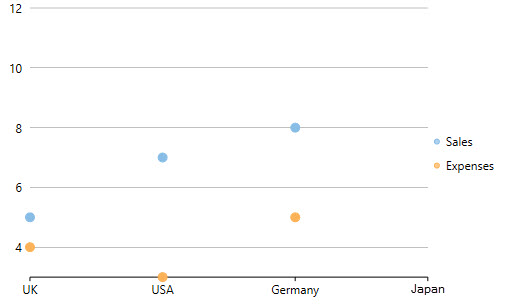
The Scatter Chart, which is also known as the XY Chart, depicts relationship among items of different data series. In simple terms, it is a plot of X values and Y values along the two axes. The data points are not connected and can be customized using different symbols. This chart type is normally used to represent scientific data, and can highlight the deviation of assembled data from predicted data or result.
To create the Scatter Chart, you can set the ChartType property to Scatter at design-time, in the code behind, or in XAML.
Set the Stacking property to Stacked or Stacked100pc to create the stacking Scatter Chart.
Scatter Chart
Below is the code implementing the scenario: