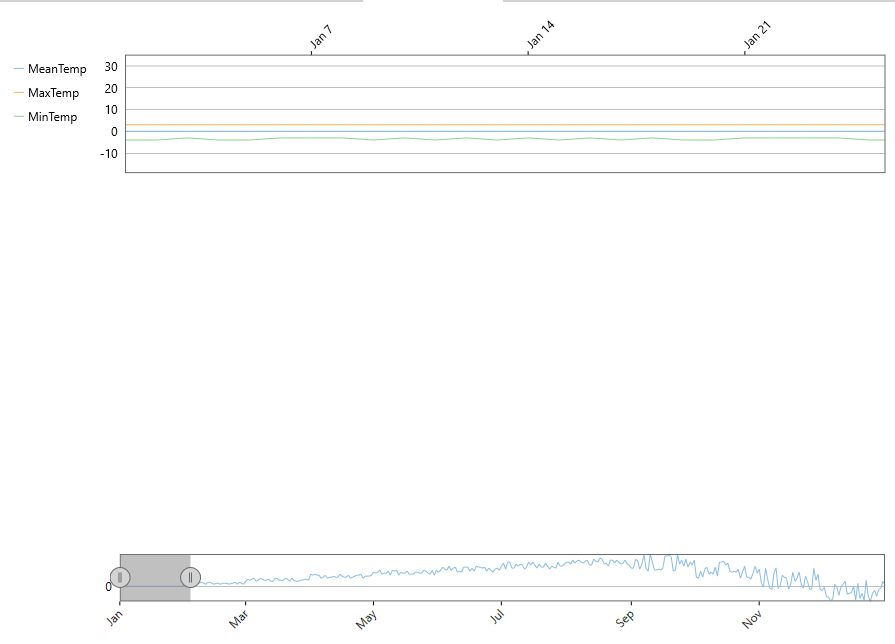
While scrollbars are a traditional way of scrolling the chart, Range Selector is a more modern approach, which lets the user visualize where the selected range sits in the complete data range.
FlexChart's Range Selector lets you select a range of numeric data with lower value thumb and upper value thumb. These thumbs define the start and end values of the range. On dragging the thumb towards left (or down) on the range bar, you reduce its value, and dragging it towards the right (or up) increases the value on the range bar.
In FlexChart, you can work with Range Selector by creating an instance of the C1.WPF.Chart.Interaction.C1RangeSelector class and adding it to the Layers collection of the chart by using the Layers property of C1FlexChart. The C1RangeSelector class inherits the C1.WPF.C1RangeSlider class. You can use the LowerValue and the UpperValue property provided by C1RangeSlider to set the lower and the upper value of the range selector respectively. The ValueChanged event fires when any of the LowerValue or the UpperValue property is changed.
To set the horizontal or the vertical orientation of the range selector, you can use the Orientation property. When the property is changed, the OrientationChanged event fires.
Here is the code snippet showing the implementation: